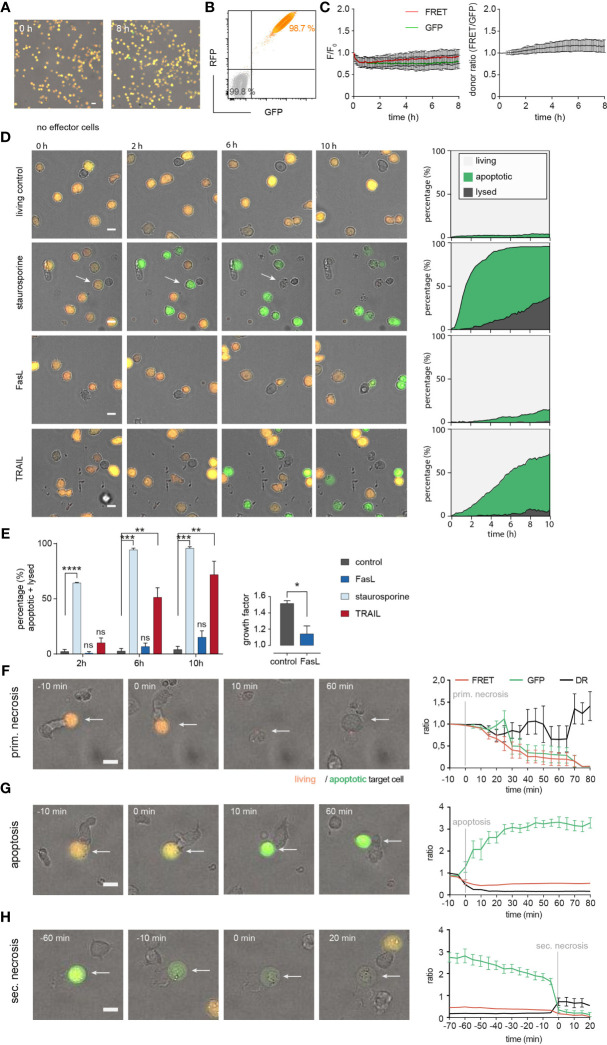
Figure 4.
Establishing NALM6 pCasper at single cell level as target cells for SEA-CTL to distinguish between apoptotic and necrotic cell death. (A) Viability of NALM6 pCasper cells at 37° C, 5% CO2 for 8h. Viable cells are orange, apoptotic cells are green. (B) NALM6 cells were stably transfected with pCasper-GR. GFP and RFP fluorescence of NALM6 pCasper in comparison to non-transfected NALM6 cells (grey) detected by flow cytometry as dot blot. (C) Time-resolved averaged normalized GFP and FRET fluorescence (left) and FRET donor ratio (right) over 8h. (D, E) Detection of apoptosis induction by staurosporine, anti-Fas (Apo1-1) mimicking FasL or recombinant TRAIL. (D) Representative images and automated death plot analysis of NALM6 pCasper cells (control, n=426 cells) over 10h treated with 20 µM staurosporine (n=283 cells), 5 µg/ml APO1-1 (n=254 cells) or 5 µg/ml recombinant TRAIL (n=405 cells) are shown. (E) Quantification of the fraction of apoptotic and lysed cells and the effect of Apo1-1 treatment (p=0.037) on the growth factor (mean #cells (600 min)/#cells (0-60 min)), single donor, duplicates. Statistical analysis was done using a Friedman test. Specific combinations of substances were used to inhibit perforin and death receptor mediated cytotoxic mechanisms during the assay and by 2h of preincubation. (F) Representative lysis event showing a primary necrosis and time-resolved averaged normalized GFP and FRET fluorescence of five cells. (G) Representative lysis event showing an apoptosis and time-resolved averaged normalized GFP and FRET fluorescence of seven cells. (H) Representative lysis event showing a secondary necrosis following an apoptosis and time-resolved averaged normalized GFP and FRET fluorescence of seven cells. (F-H) SEA-CTL were used as effector cells. Scale bars are 10 µm. * p<0.05; ** p<0.01; ***p<0.001, ****p<0.0001; ns, no significant difference.

