. 2021 Nov 18;11(59):37181–37193. doi: 10.1039/d1ra05737e

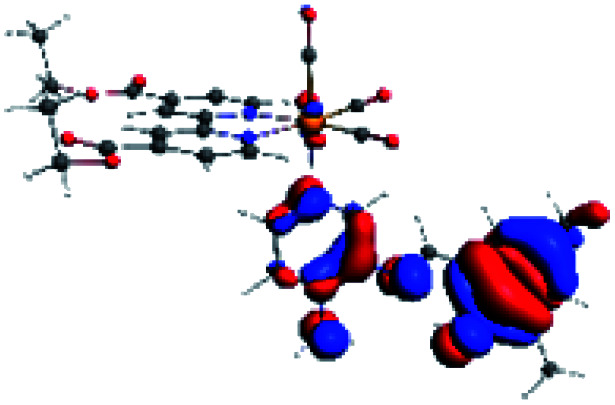
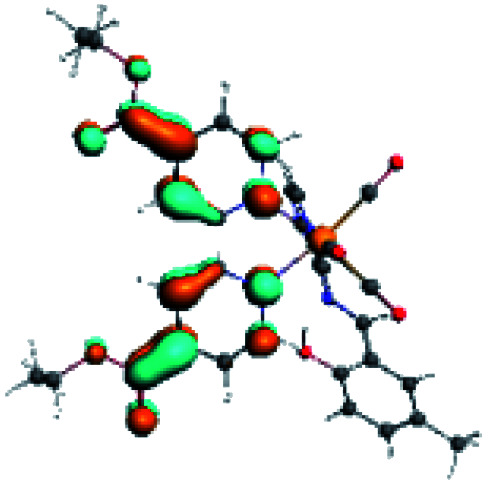
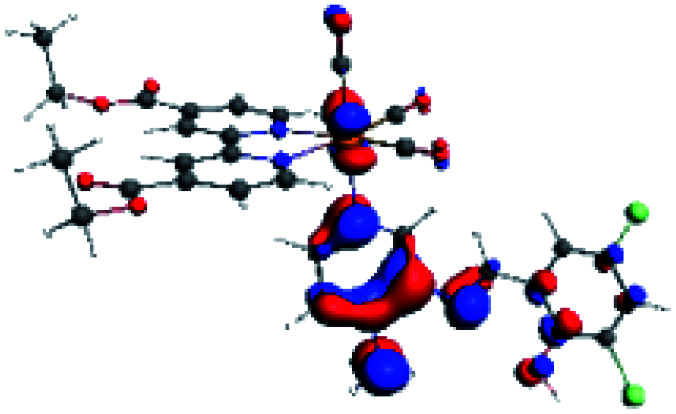
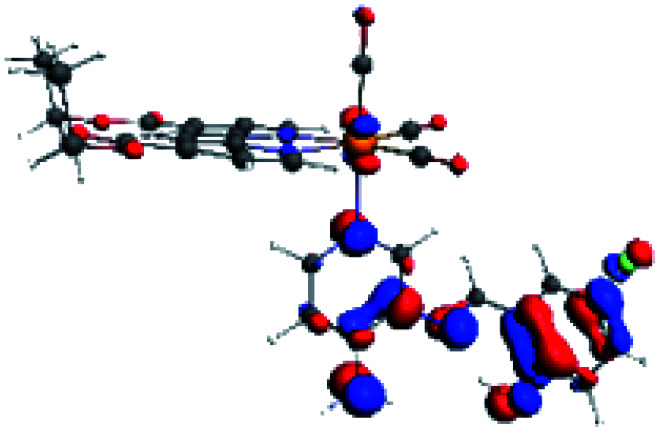
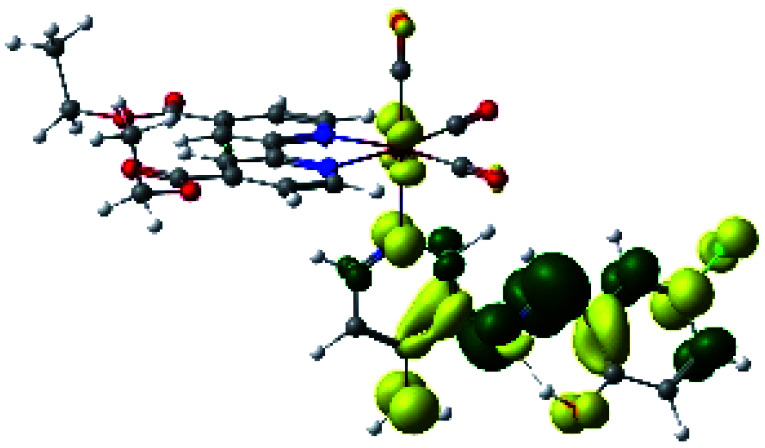
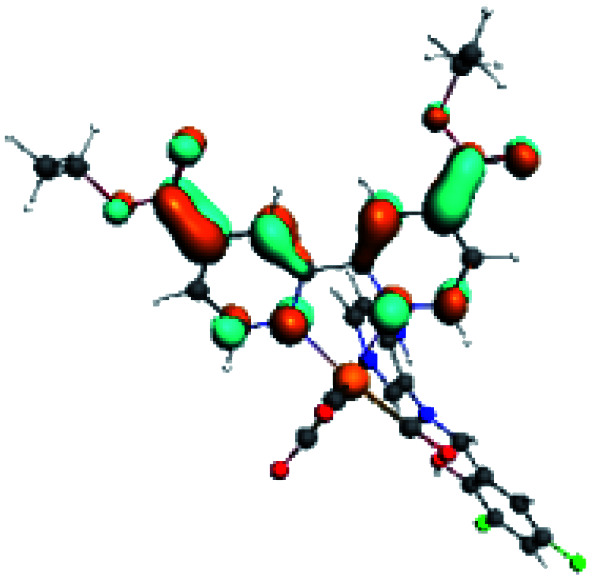
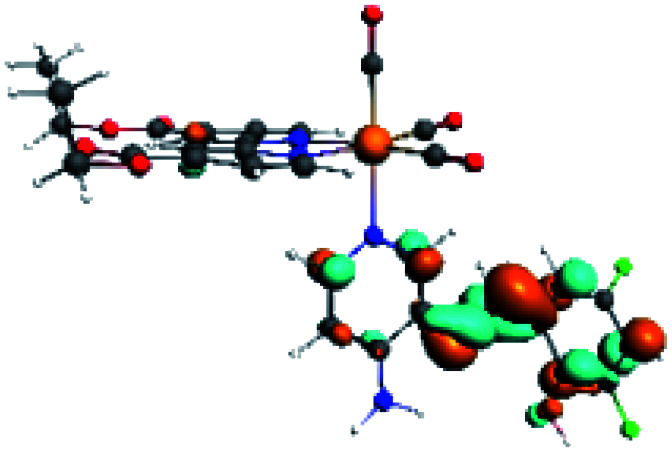
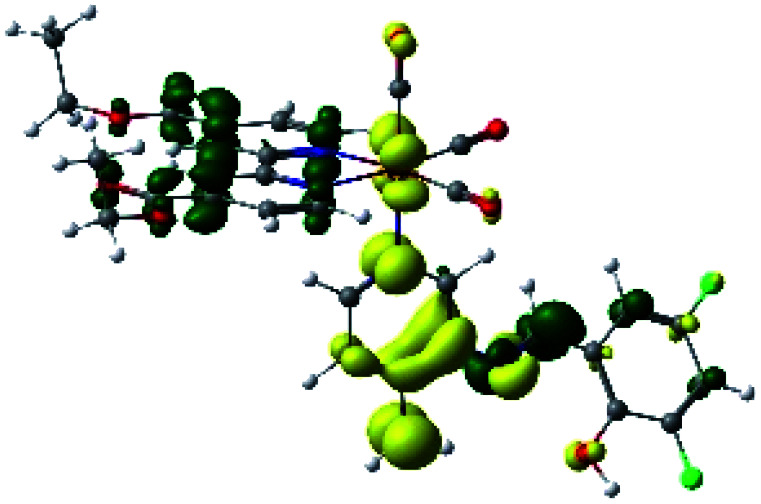
Molecular orbitals and maps of electron density differences between the states involved in the electronic transition of absorption located at 387–401 nm for R5 to R10 (yellow: density reduction; and green: density increment due to the transition).

Complex HOMO LUMO+3 LUMO+2 Density diff.
R5 graphic file with name d1ra05737e-u13.jpg graphic file with name d1ra05737e-u14.jpg graphic file with name d1ra05737e-u15.jpg graphic file with name d1ra05737e-u16.jpg
R6 HOMO LUMO+1 LUMO+2 Density diff.
graphic file with name d1ra05737e-u17.jpg graphic file with name d1ra05737e-u18.jpg graphic file with name d1ra05737e-u19.jpg graphic file with name d1ra05737e-u20.jpg
R7 graphic file with name d1ra05737e-u21.jpg graphic file with name d1ra05737e-u22.jpg graphic file with name d1ra05737e-u23.jpg graphic file with name d1ra05737e-u24.jpg
R8 HOMO LUMO+2 Density diff.
graphic file with name d1ra05737e-u25.jpg graphic file with name d1ra05737e-u26.jpg graphic file with name d1ra05737e-u27.jpg
R9 HOMO LUMO+1 LUMO+2 Density diff.
graphic file with name d1ra05737e-u28.jpg graphic file with name d1ra05737e-u29.jpg graphic file with name d1ra05737e-u30.jpg graphic file with name d1ra05737e-u31.jpg
R10 HOMO LUMO+2 Density diff.
graphic file with name d1ra05737e-u32.jpg graphic file with name d1ra05737e-u33.jpg graphic file with name d1ra05737e-u34.jpg