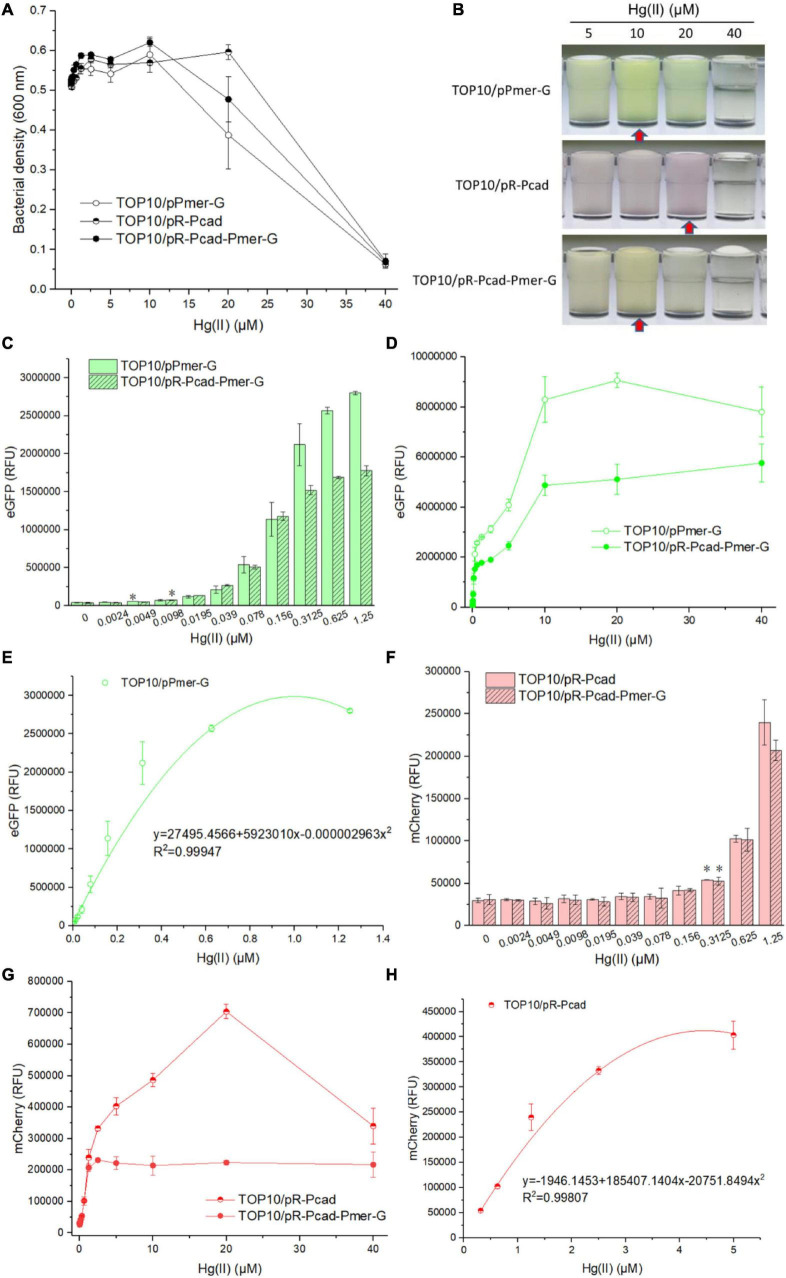
FIGURE 3.
Performance of single-sensing and dual-sensing whole-cell biosensors exposed to increased concentrations of Hg(II). Single-sensing TOP10/pPmer-G, single-sensing TOP10/pR-Pcad, and dual-sensing TOP10/pR-Pcad-Pmer-G in lag phase were exposed to increased concentrations of Hg(II). After incubation at 37oC for 8 h, bacterial cell densities (A) were determined immediately. A representative photo of induced culture (B) was shown, and the cultures with high absorbance at 600 nm were marked with red arrow. (C) The detection sensitivity when using green fluorescence as signal output. The asterisk represents a statistically significant difference (two-tailed t test, P < 0.05) compared with the same engineered biosensor not upon exposure to Hg(II). (D) The dose-dependent green fluorescent response curve for Hg(II) exposure ranges from 0 to 40 μM. (E) Regression analysis of the relationship between relative green fluorescent intensity derived from TOP10/pPmer-G and Hg(II) concentration. (F) The detection sensitivity with red fluorescence as signal output. The asterisk represents a statistically significant difference (two-tailed t-test, P < 0.05) compared with the same engineered biosensor with no Hg(II) exposure. (G) The dose-dependent red fluorescent response curve for Hg(II) exposure ranges from 0 to 40 μM. (H) Regression analysis of the relationship between relative red fluorescent intensity derived from TOP10/pR-Pcad and Hg(II) concentration. Data represent the mean ± SD of at least three independent experiments.

