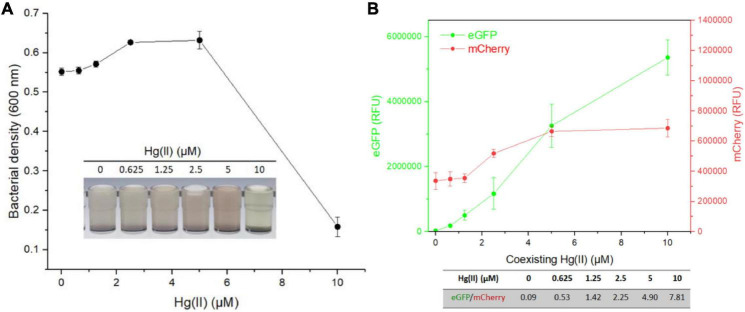
FIGURE 6.
Influence of Cd(II) at a constant concentration on the response of dual-sensing biosensor toward Hg(II) at varied concentrations from 0 to 10 μM. Dual-sensing TOP10/pR-Pcad-Pmer-G in lag phase were exposed to 100 μM Cd(II) in the presence of increased concentrations of Hg(II). After incubation at 37oC for 8 h, bacterial cell densities (A) were determined immediately. The inset is a representative photo of induced cultures. Double-color fluorescence derived from TOP10/pR-Pcad-Pmer-G was then determined (B), and the mean of fluorescence intensity ratios (eGFP/mCherry) were shown in the table below the corresponding figure. Data represent the mean ± SD of at least three independent experiments.

