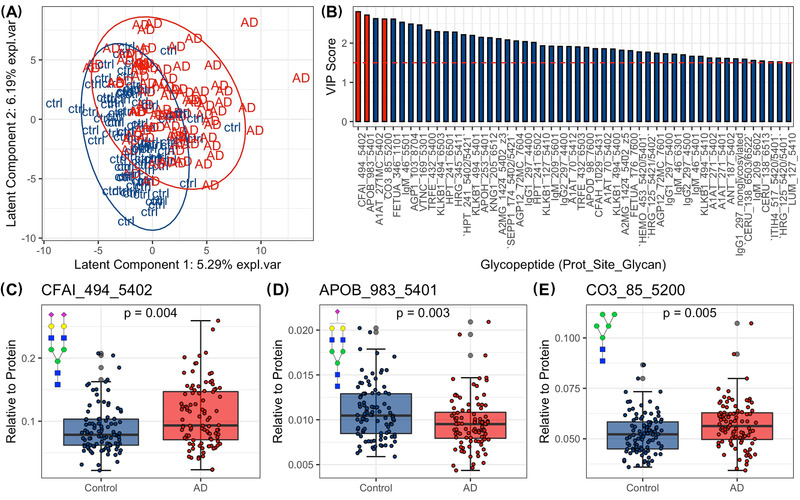
FIGURE 2.

Changes in serum glycopeptide abundance in serum samples from Alzheimer's disease (AD) patients compared to controls using PLS‐DA. (A) The scores plot shows the distribution of participants across latent components 1 and 2 given the PLS‐DA model for glycopeptides. (B) Variables with VIP scores ≥1.5 and their VIP scores. Variable colored in red are those selected for differential analysis and are visualized in C‐E. (C‐E) Boxplots showing the differences in abundances of glycopeptides from control and AD samples. Protein complement factor I (CFAI), apolipoprotein B (apolipoprotein B) and Complement C3 (CO3). N‐glycan symbol key: yellow circles, galactose (Gal); green circles, mannose (Man); blue squares, N‐acetylglucosamine (GlcNAc); red triangles, fucose (Fuc); purple diamonds, N‐acetylneuraminic acid (Neu5Ac)
