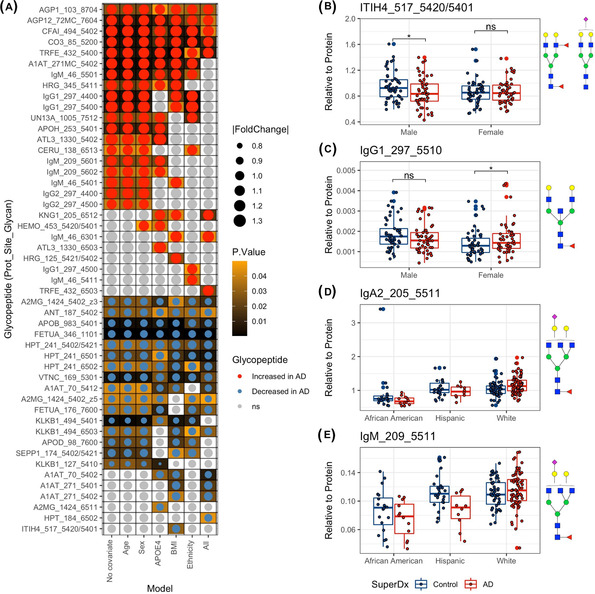
FIGURE 3.

Differential analysis of glycopeptides and the impact of confounders on glycopeptide abundance. (A) The heatmap shows glycopeptides significantly different in Alzheimer's disease (AD) patients compared to controls using univariate and multivariate linear regressions. The dot size shows the effect size (absolute fold change). Darker background color refers to smaller P‐value (before multiple testing correction). (B‐C) The boxplot shows the sex specific diagnosis effects on serum glycopeptide abundance. Differences with P‐value < .05 are denoted by asterisk, whereas differences with P > .05 are denoted as “ns” (not significant). (D‐E) Boxplot showing the ethnicity specific diagnosis effects on serum glycopeptide abundance. Protein abbreviations: Inter‐alpha‐trypsin inhibitor heavy chain H1 (ITIH), immunoglobulin G1 (IgG1), immunoglobulin A2 (IgA2), and immunoglobulin M (IgM). N‐glycan symbol key: yellow circles, galactose (Gal); green circles, mannose (Man); blue squares, N‐acetylglucosamine (GlcNAc); red triangles, fucose (Fuc); purple diamonds, N‐acetylneuraminic acid (Neu5Ac)
