Figure 2.
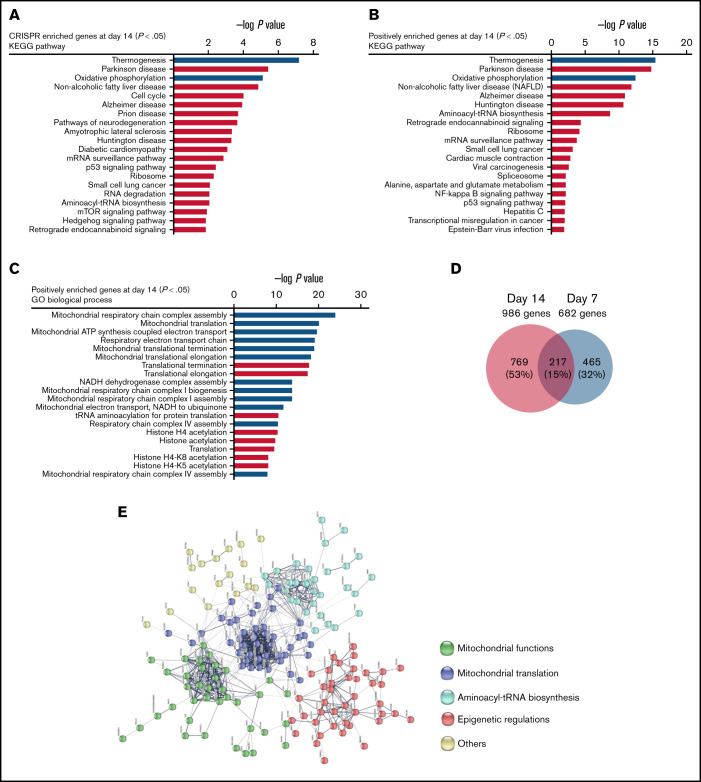
Pathway analysis of genome-wide CRISPR/Cas9 screening enriched genes. (A) KEGG pathway analysis of significantly enriched genes in the CRISPR/Cas9 screening at day 14 (P < .05) after panobinostat treatment. (B) KEGG pathway analysis of positively enriched genes in the CRISPR/Cas9 screening at day 14 (P < .05) after panobinostat treatment. (C) GO biological process analysis positively enriched genes in the CRISPR/Cas9 screening at day 14 (P < .05) after panobinostat treatment. (D) Venn diagram of the positively selected genes in the CRISPR/Cas9 screening at days 7 (P < .05) and 14 (P < .05) after panobinostat treatment. (E) STRING protein-protein interaction network analysis of the 217 common positively selected genes as defined in panel D. The minimum required interaction score was set to 0.5, and the disconnected dots were removed. K-means clustering was applied with the number of clusters set to 5.

