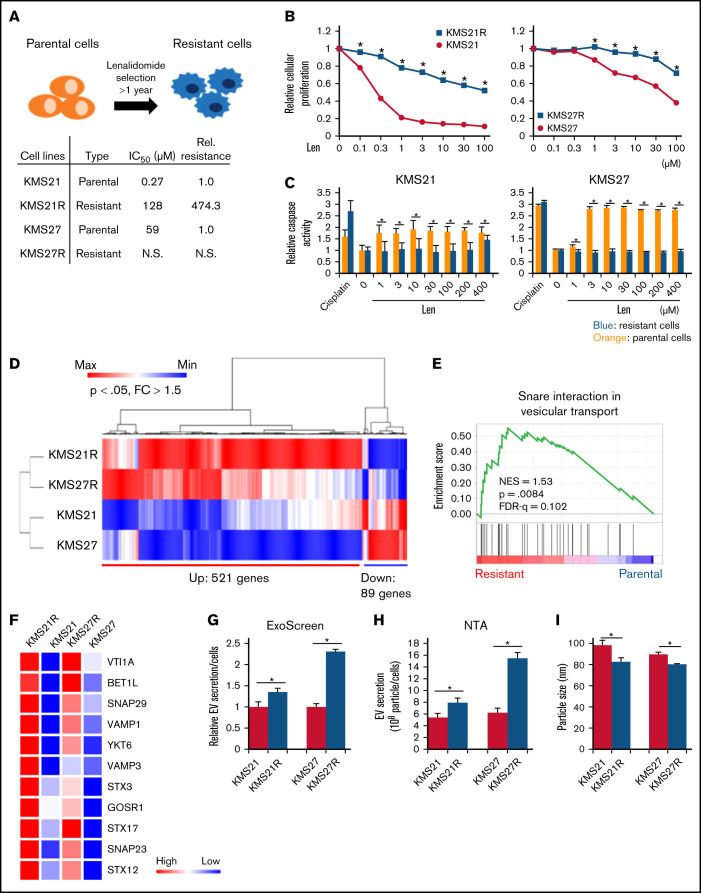
Figure 1.
Comparative analysis of parental and lenalidomide-resistant MM cell lines. (A) Illustration of the method for establishing lenalidomide-resistant cell lines. Relative resistance score (Rel. resistance) = (resistant cell 50% inhibitory concentration [IC50]/parental cell IC50). (B) Cell viability assay with Cell Counting Kit-8. The values were normalized to those of the negative control. The cells were incubated for 72 hours. (C) Caspase activity was measured with a caspase 3/7 assay kit. Cisplatin was used as a positive control. The cells were incubated for 72 hours. (D) Heatmap showing gene expression in lenalidomide-resistant cells and parental cells. P < .05, fold change (FC) > 1.5. (E) Gene set enrichment analysis results showing the enriched pathways in resistant cell lines. (F) Heatmap showing gene expression in the snare interaction in vesicular transport-associated gene set. (G) Measurement of EV secretion by an ExoScreen assay. The vertical axis in the graphs shows the ExoScreen signals normalized to the cell viability signals. Signal values were normalized to those of the negative control. The cells were incubated for 72 hours. (H) Nanoparticle tracking analysis (NTA). The particle count was normalized to the cell count. (I) The particle size indicates the median size. The error bars indicate standard deviation values. *P < .05. FDR, false discovery rate; Len, lenalidomide; max, maximum; min, minimum; NES, normalized enrichment score; N.S., not significant.

