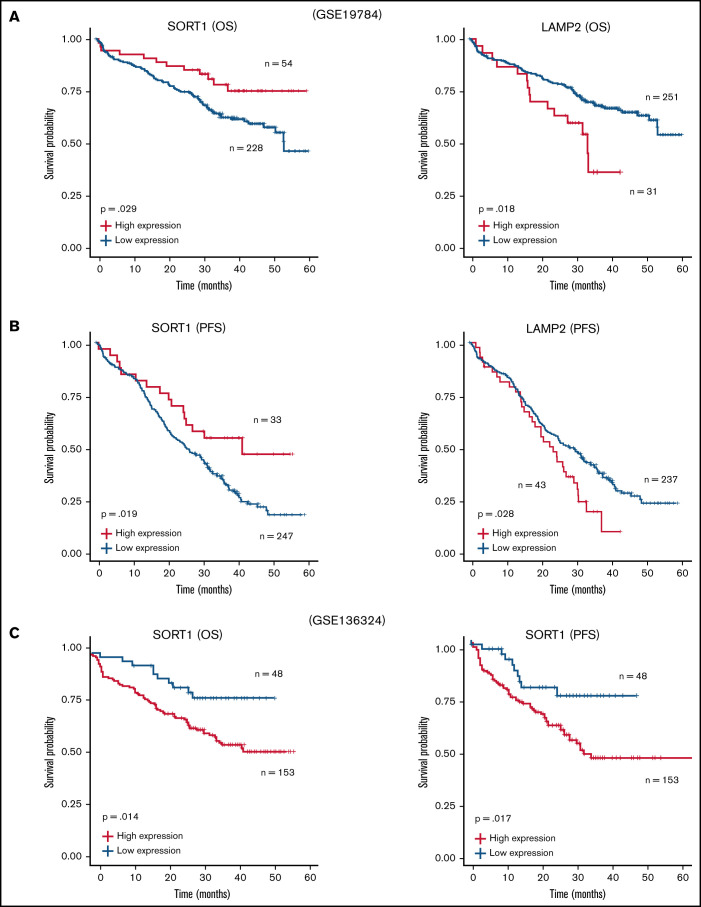
Figure 6.
Survival analysis with SORT1 and LAMP2 expression profiles in clinical MM. (A-B) Kaplan-Meier plots with SORT1 and LAMP2 expression profiles in GSE19784 data sets using end points of OS status (A) and PFS status (B). Low expression of SORT1 correlated to poor prognosis with OS (high, n = 54; low, n = 228) and PFS (high, n = 33; low, n = 247) end points. High expression of LAMP2 correlated to poor prognosis with OS (high, n = 31; low, n = 251) and PFS (high, n = 43; low, n = 237) end points. (C) Kaplan-Meier plots with SORT1 expression profiles in GSE136324 data sets using end points of OS status (left panel) and PFS status (right panel). High expression of SORT1 correlated to poor prognosis with OS (high, n = 153; low, n = 48) and PFS (high, n = 153; low, n = 48) end points.

