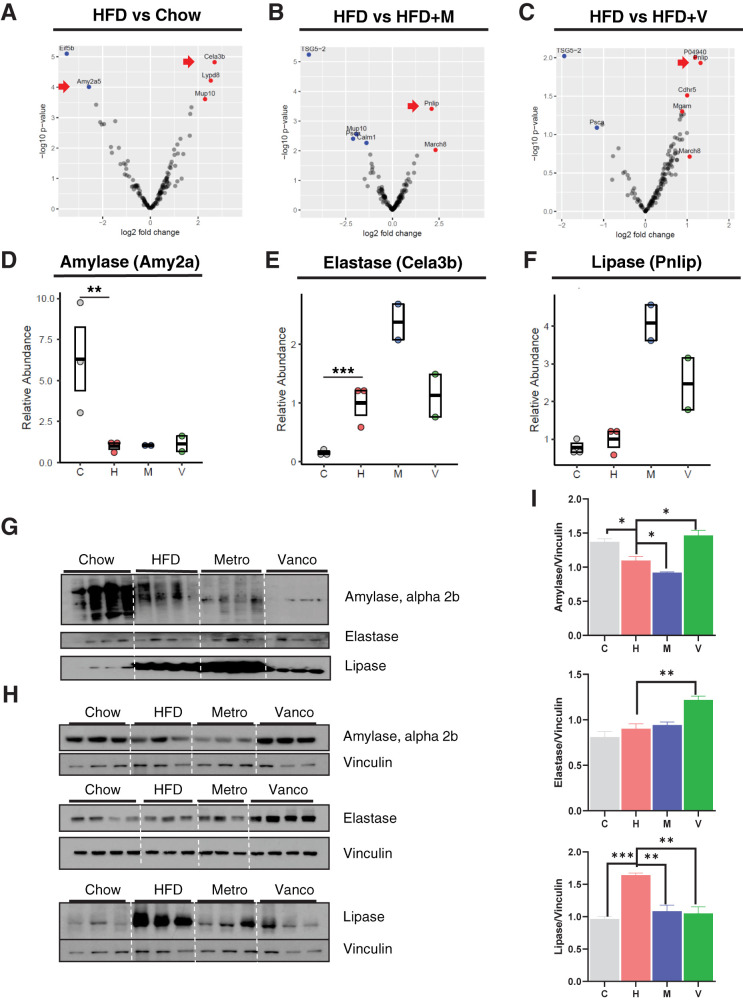
Figure 2.
Gut microbiota alters exocrine pancreas function. Volcano plot shows the distribution of differentially identified proteins by HFD (A), metronidazole (M) (B), and vancomycin (V) (C) in a log10 scale. C, chow; H, HFD. Dot/box plots show the relative abundance of amylase (D), elastase (E), and lipase (F). Data represent mean ± SEM (n = 2–3 per group). *P ≤ 0.05, **P ≤ 0.01. G: Western blots of fecal protein extracts (9 weeks on the HFD; 10 weeks on antibiotics). Metro, metronidazole; Vanco, vancomycin. Western blots for protein extracts of pancreas (H) and quantification of amylase, elastase, and lipase levels normalized to vinculin (I). Data represent mean ± SEM (n = 4 per group). *P ≤ 0.05, **P ≤ 0.01.

