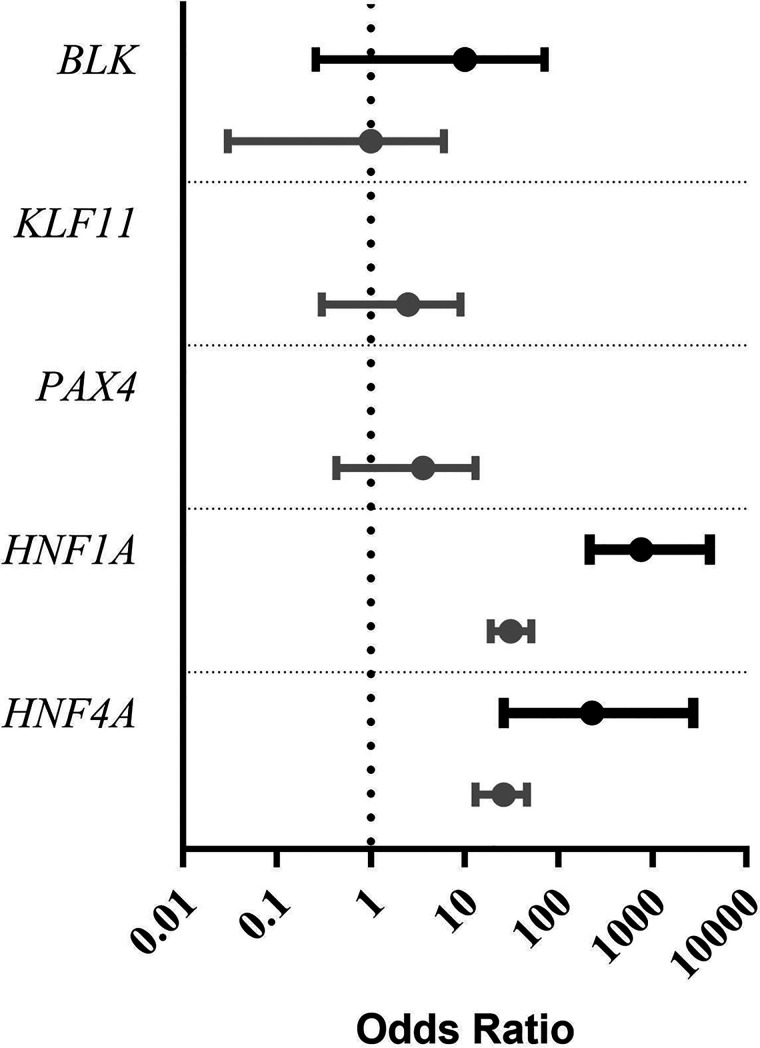
Figure 1.
Graph showing the ORs for ultra-rare (allele count = 1) PTV (black lines) and missense variants (gray lines) in a MODY cohort (n = 1,227) compared with the population cohort UK Biobank (n = 185,898). Dotted line shows an OR of 1. Bar not shown for KLF11 and PAX4 PTV, as OR is 0, which cannot be plotted on a log axis.

