Figure 2.
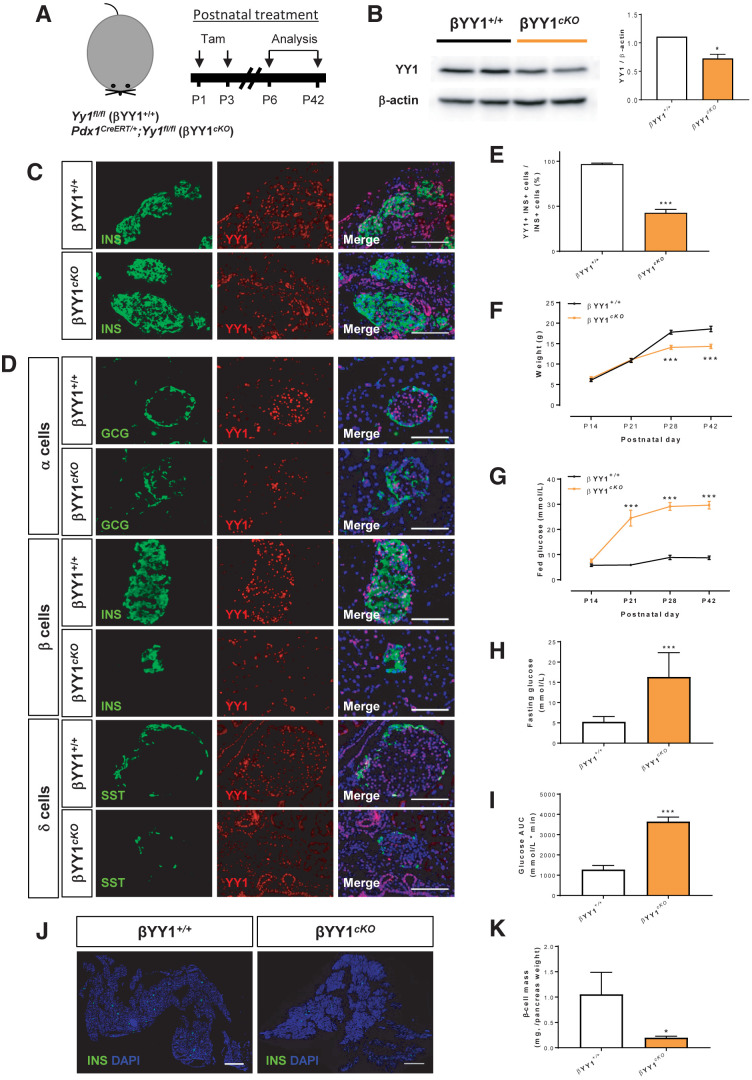
YY1 regulates glucose homeostasis in neonatal β-cells. (A) Schematic diagram showing the experimental strategy using neonatal Pdx1CreERT/+;Yy1fl/fl mice. Tam was administered at P1 and P3. (B) Western blotting showing a significant reduction in islet YY1 expression in Pdx1CreERT/+;Yy1fl/fl mice, compared with Yy1fl/fl (control) mice, at day 3 after Tam treatment. Data are presented as mean ± SEM; *P < 0.05; n = 9 mice per group; islets of three pancreata were pooled for each band. (C and D) Immunostaining of frozen pancreatic sections for GCG (green), INS (green), or SST (green), and YY1 (red) with nuclear Hoechst counterstain (blue) at (C) 3 days or (D) 6 weeks after Tam treatment, showing specific knockout of YY1 in INS+ β-cells. Scale bars: 100 μm. (E) Quantification of (D) showing at least 50% of INS+ cells were devoid of YY1 at 6 weeks after Tam treatment. (F–I) The physiological change in mice was recorded in terms of (F) body weight, (G) fed blood glucose levels, (H) fasting blood glucose levels, and (I) glucose tolerance test at 2–6 weeks after Tam treatment, showing the onset of hyperglycemia and impaired glucose tolerance after β-cell loss of YY1. Data are presented as mean ± SEM; ***P < 0.001 compared with that of the control group; n = 9 mice for control and n = 9–12 mice for the cKO group. (J) Immunostaining of frozen pancreatic sections for INS (green) with nuclear Hoechst counterstain (blue) at 6 weeks after Tam administration. Scale bars: 2,000 μm. (K) Quantification of (J) showing significantly reduced β-cell mass (INS+ area/total pancreas area × pancreas weight) at 6 weeks after Tam treatment. Data are presented as mean ± SEM; *P < 0.05; n = 3 mice per group.

