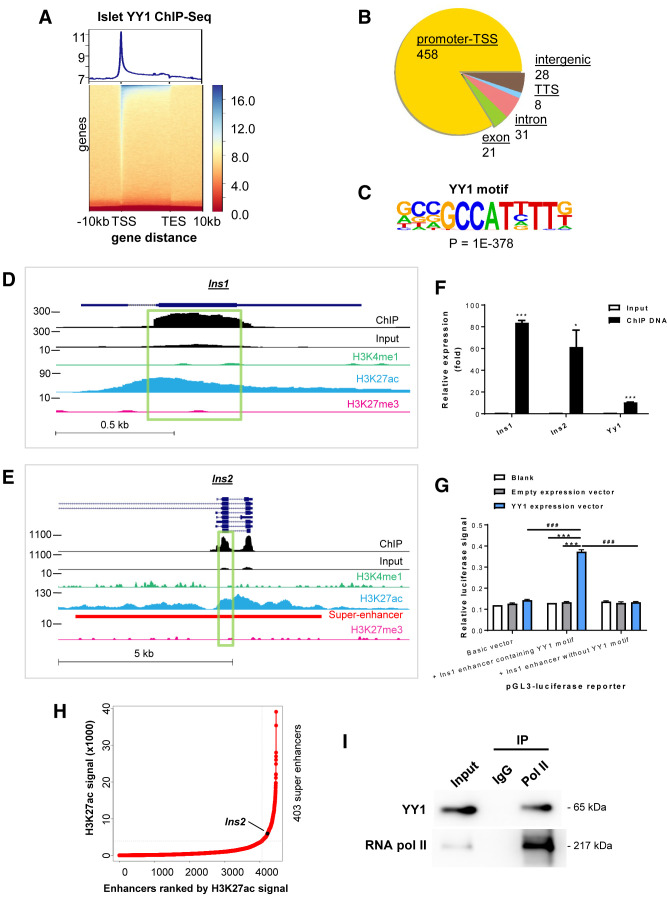
Figure 5.
Integrative transcriptomic, genetic, and epigenetic analyses demonstrate transcriptional activation of the INS genes by YY1 by stabilizing the enhancer–promoter interaction. (A) Heat map representing the normalized YY1 ChIP-seq intensities ± 10 kb over the gene body from TSS to transcription end site (TES) of YY1-bound DNA in pancreatic islets. The upper panel shows an enrichment plot representing the average distribution of YY1 intensities ± 10 kb over the gene body. (B) Typical peak annotation pie chart shows that the majority of the peaks fall into promoter/TSS regions. (C) De novo motif discovery using all the 546 peaks of YY1 ChIP-seq data. The motif of β-cells was compared with the available consensus and optimal motifs of other cell types in the indicated references. (D and E) Genome snapshots for YY1, H3K4me1, H3K27ac, and H3K27me3 ChIP-seq analyses performed in pancreatic islets at the (D) Ins1 and (E) Ins2 loci. The superenhancer region was also highlighted in Ins2. (F) ChIP-qPCR showing the enrichment of YY1 on exon 2 of Ins1 and Ins2. Chromatin of Ins-1 cells was immunoprecipitated using an anti-YY1 antibody. Input served as nonimmunoprecipitated controls. The relative enrichment values were normalized to β-actin because there is no YY1 binding site on this housekeeping gene. Data are presented as mean ± SEM; *P < 0.05, ***P < 0.001; n = 3 independent experiments. (G) Luciferase report assays showing that the luciferase signals driven under the control of a GCCAT-containing Ins1 enhancer were significantly increased compared with that driven under the Ins1 enhancer without the motif after forced expression of YY1 in Ins-1 cells. Data are presented as mean ± SEM; ***P < 0.001 compared with blank or empty expression vector; ###P < 0.001 compared with luciferase reporter containing Ins1 enhancer without YY1 binding motif; n = 3 independent experiments. (H) A 12.5 kb distance threshold was used to stitch islet-specific enhancers together, and the stitched enhancers based on H3K27ac ChIP-seq signals were ranked using the ROSE algorithm. Superenhancer of Ins is indicated. (I) Western blotting analyses of co-immunoprecipitation of YY1 and RNA pol II from nuclear extract of pancreatic islets using anti-RNA pol II antibody. IgG was used in control immunoprecipitation, and the amount of input loaded for immunoprecipitation was 2%.

