Figure 6.
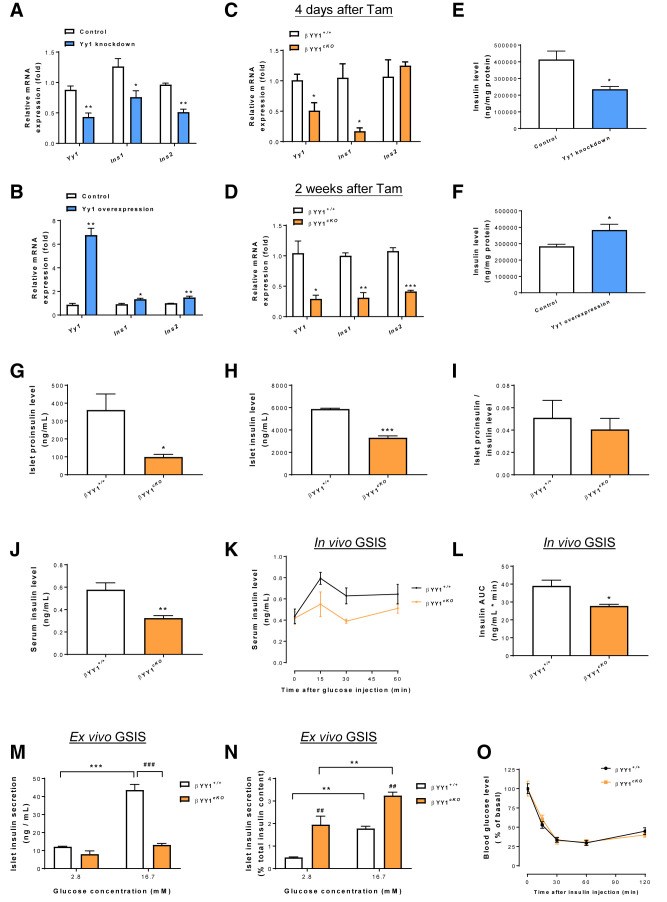
YY1 regulates glucose homeostasis by controlling INS production in β-cells. (A–D) Quantitative RT-qPCR analyses in (A and B) pancreatic β-cells in vitro or (C and D) pancreatic islets in vivo. (A and B) Compared with the control groups, significantly (A) reduced and (B) increased transcription levels of Ins1 and Ins2 were observed at 48 hours after treatment with Yy1 siRNA and overexpression vector, respectively, in pancreatic β-cells. (C and D) Compared with the Yy1fl/fl (control) groups, significantly reduced transcription levels of Ins1 and/or Ins2 were also found at (C) 4 days or (D) 2 weeks after Tam treatment in adult Pdx1CreERT/+;Yy1fl/fl (cKO) islets. (E and F) ELISA assays showing reduced and increased INS levels in pancreatic β-cells after stable knockdown of Yy1 for 96 hours and overexpression of Yy1 for 72 hours, respectively, compared with that of the control groups. (G–J) ELISA assays showing significantly (G) reduced islet proinsulin levels, (H) reduced islet INS levels in size-matched cKO islets, or (J) reduced serum INS levels in the circulating blood of cKO mice at 2 weeks after Tam administration compared with that of the control mice. (I) No significant difference in islet proinsulin/INS levels was found. (K and L) In vivo GSIS assays showing significantly impaired serum INS response to intraperitoneal (i.p.) glucose injection at 2 mg/g body weight in cKO compared with control mice at 2 weeks after Tam treatment. (A–L) Data are presented as mean ± SEM; *P < 0.05, **P < 0.01, ***P < 0.001; n = 3 independent experiments in vitro or n = 4 mice per group in vivo. (M and N) Quantification of INS secretion from size-matched pancreatic islets in response to 2.8 and 16.7 mmol/L glucose showing (M) significantly impaired or (N) enhanced ex vivo GSIS in cKO islets at 2 weeks after Tam treatment without or with reference to total INS content, respectively. Data are presented as mean ± SEM; **P < 0.01, ***P < 0.001 compared within the same types of islets; ##P < 0.01, ###P < 0.001 compared between cKO and control islets; n = 4 mice per group per condition. (O) In vivo intention-to-treat assays showing no difference in INS sensitivity after i.p. INS injection at 0.5 units/kg body weight between the cKO and control groups at 2 weeks after Tam treatment. AUC, area under the curve.

