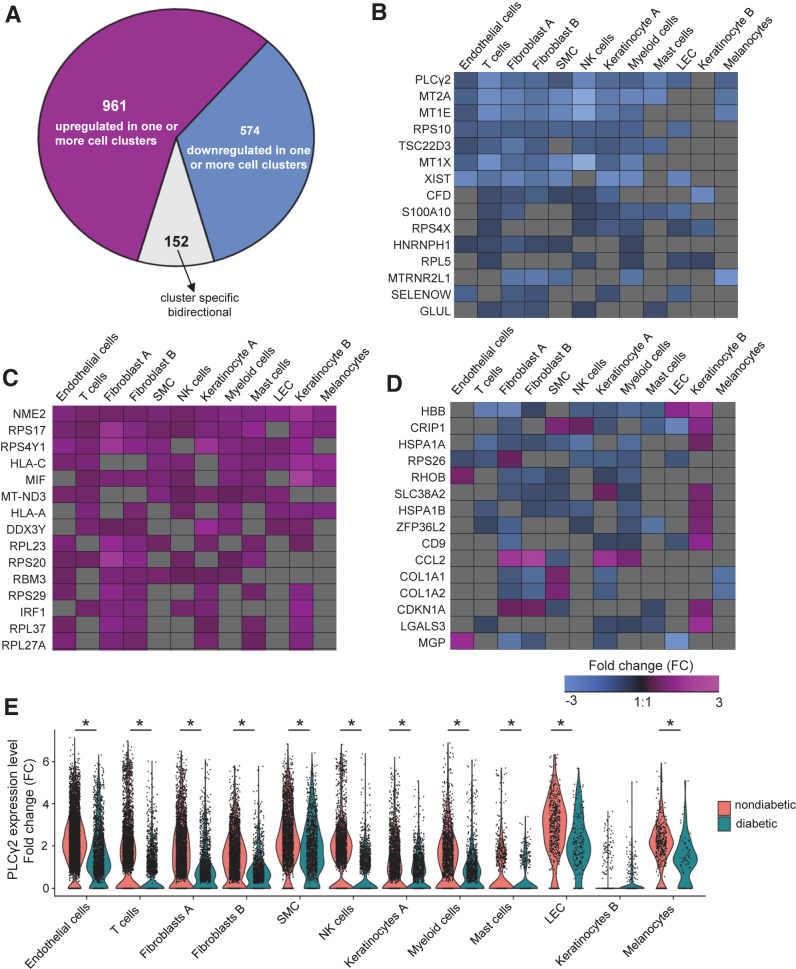
Figure 2.
Diabetes-related DEGs in distinct cell types of skin. A: Pie chart showing the number of the upregulated, downregulated, or bidirectional genes across all identified clusters. Heat map showing a subset of genes that has shared downregulation (B) or shared upregulation (C) (FDR-adjusted P < 0.05 and logFC ±0.25) in diabetic skin. D: Heat map of logFC showing a subset of diabetic-related genes (FDR-adjusted P < 0.05 and logFC ±0.25) that has bidirectional genes (down- or upregulated) in different clusters of the skin. Heat maps were created using Genesis software. E: Violin plot representing expression level of PLCγ2 in each cellular cluster in diabetic and nondiabetic skin. Each cell is represented as a dot. PLCγ2 was downregulated in 11 cellular clusters in diabetic skin (not significantly different in only keratinocyte B cluster) (*FDR-adjusted P < 0.05).

