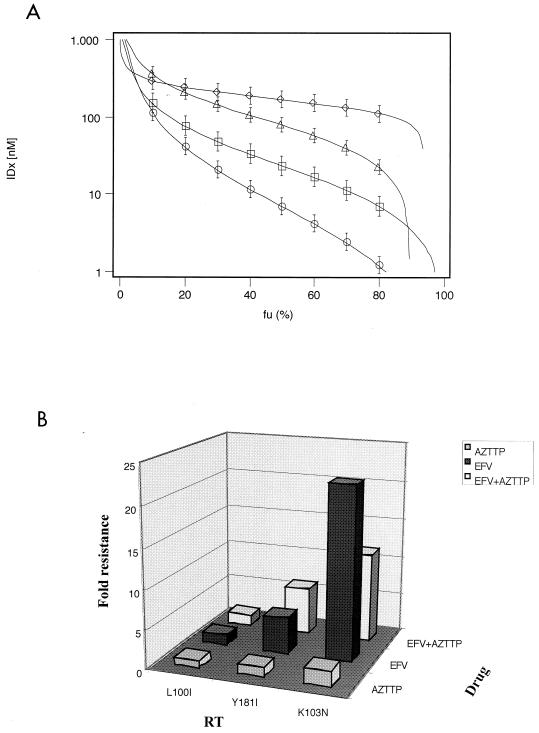
FIG. 1.
Resistance of wt and three mutant HIV-1 RTs to different combinations of NNRTIs and NRTIs. Dose-response curves for RTwt and mutants have been generated, as outlined in Materials and Methods, by fitting experimental data to equation 2 and then calculating the respective inhibition doses (IDx) at different x (%) of inhibition according to equation 3. (A) Dose-response curves for the combination of efavirenz (EFV) and AZTTP. The fraction of uninhibited activity (fu = %Econ) has been plotted versus the calculated IDx for RTwt (circles), L100I (squares), Y181I (triangles), and K103N (rhombics). Calculated parameters: (D1 + D2)wt = 15 nM; mwt = −0.79; (D1 + D2)L100I = 22.7 nM, mL100It = −1.17; (D1 + D2)Y1811 = 91.7 nM, mY1811 = −1.49; (D1 + D2)K103N = 172 nM, mK103N = −3.95. (B) Comparison of the relative resistance values (D50mut/D50wt) of different mutant RT enzymes towards efavirenz and AZTTP either individually or in combination. D50 values for the combination were calculated from the dose-response curves shown in panel A, whereas the correspondent values for the single drugs were derived from Table 1.

