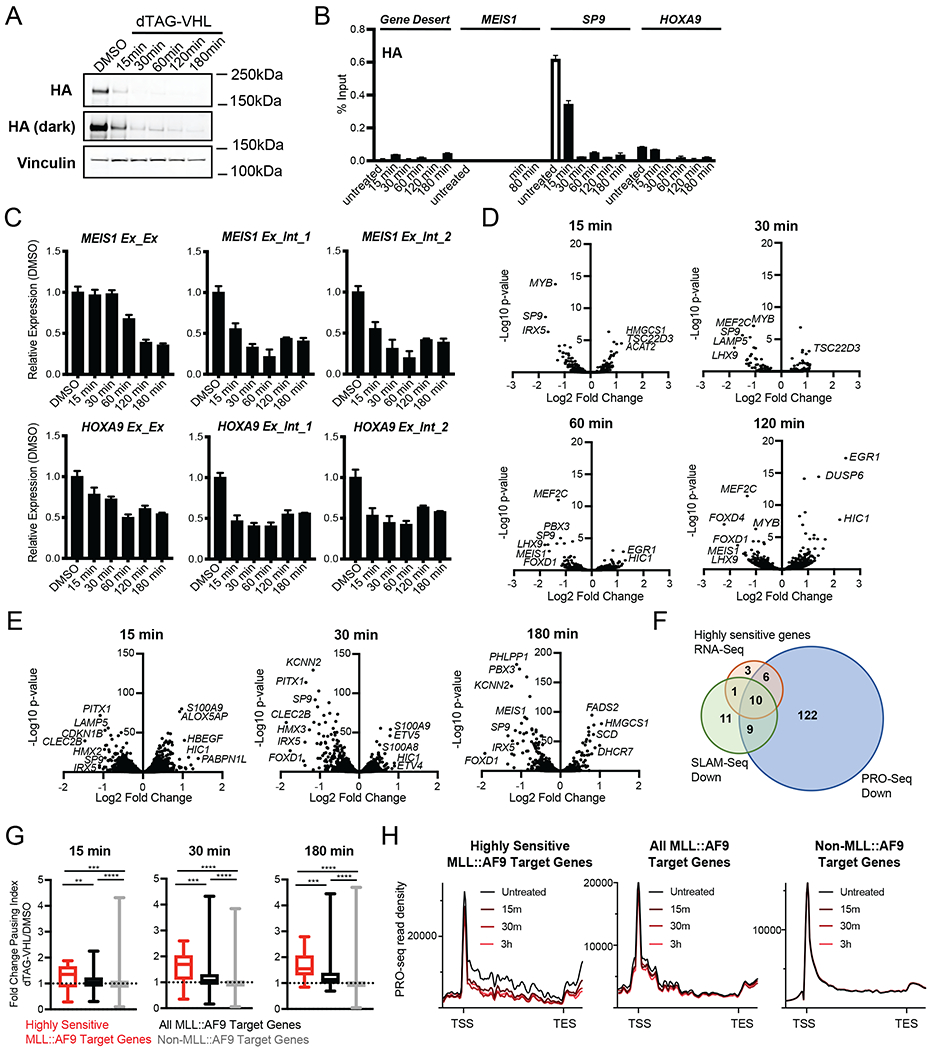
Figure 3. MLL::AF9 degradation induces transcriptional changes within minutes via increased RNA Polymerase II pausing in human MLL::AF9-FKBP12 cells.

A. Western blot upon dTAG-VHL (500nM) treatment at the indicated timepoints. HA levels were assessed by immunoblotting.
B. ChIP-qPCR of HA (MLL::AF9) at the indicated genes plotted as percent Input following dTAG-VHL (500nM) treatment for the indicated timepoints. Data are represented as mean + SD of experimental triplicates.
C. Relative expression of MEIS1 and HOXA9 upon dTAG-VHL (500nM) treatment for the indicated timepoints, normalized to DMSO. Exon/Exon or Exon/Intron primers were used as indicated. Data are represented as mean + SD of three independent experiments, measured by SYBR green.
D. Volcano plots of differentially transcribed genes following 15, 30, 60, and 120 minutes of dTAG-VHL (500nM) treatment as measured by SLAM-Seq (Table S2).
E. Volcano plots of differentially transcribed genes following 15, 30, and 180 minutes of dTAG-VHL (500nM) treatment as measured by PRO-Seq (Table S2).
F. Venn diagrams depicting the overlap of genes exhibiting decreased transcription upon dTAG-VHL (500nM) treatment by RNA-seq (red, shown in Figure 2A, Table S1), SLAM-Seq (green, Log2 FC>1, p<0.05 at any of the four timepoints shown in Figure 3D, Table S2), and PRO-Seq (blue, FC>1.5, p<0.0001 at any of the three timepoints shown in Figure 3E, Table S2).
G. Boxplots of DMSO-normalized fold change in pausing index (see Figure S3E) after dTAG-VHL (500nM) treatment at the indicated timepoints.
H. Metagene plots of PRO-seq read density after dTAG-VHL (500nM) treatment.
ns p > 0.5; * p ≤ 0.5; * p ≤ 0.05; ** p ≤ 0.01; *** p ≤ 0.001; **** p ≤ 0.001 (Mann Whitney test)
