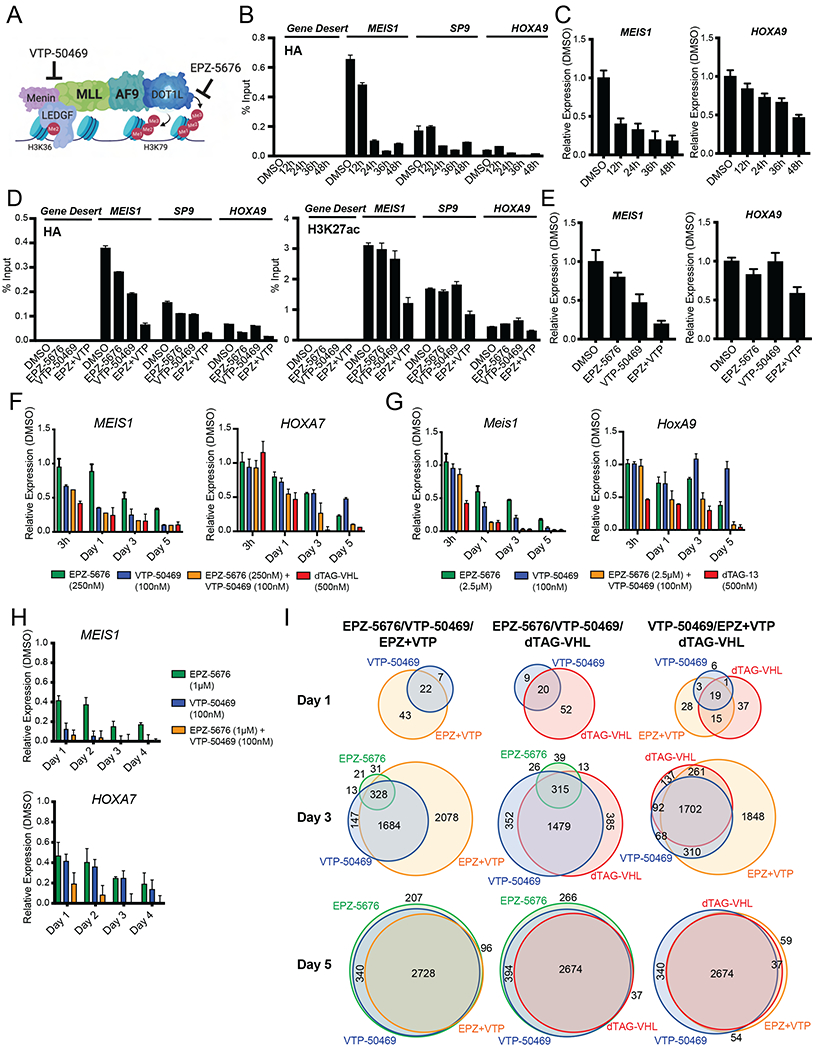
Figure 5. Combination of DOT1L and MENIN inhibition induces more rapid MLL::AF9 chromatin loss and gene expression changes compared to single agent treatment.

A. Model of the MLL::AF9 multi-protein complex and where EPZ-5676 and VTP-50469 target complex members.
B. ChIP-qPCR of HA (MLL::AF9) at the indicated genes plotted as percent Input following EPZ-5676 (250nM) + VTP-50469 (100nM) treatment for the indicated timepoints. Data are represented as mean + SD of experimental triplicates in the human MLL::AF9-FKBP12 system, measured by SYBR green.
C. Relative expression of MEIS1 and HOXA9 upon EPZ-5676 (250nM) + VTP-50469 (100nM) treatment for the indicated timepoints, normalized to DMSO. Data are represented as mean + SD of experimental triplicates in the human MLL::AF9-FKBP12 system, measured by SYBR green.
D. ChIP-qPCR of (left) HA (MLL::AF9) and (right) H3K27ac at the indicated genes plotted as percent Input following DMSO, EPZ-5676 (250nM), VTP-50469 (100nM), or the combination of EPZ-5676 (250nM) + VTP-50469 (100nM) treatment for 24 hours. Data are represented as mean + SD of experimental triplicates in the human MLL::AF9-FKBP12 system, measured by SYBR green.
E. Relative expression of MEIS1 and HOXA9 upon DMSO, EPZ-5676 (250nM), VTP-50469 (100nM), or the combination of EPZ-5676 (250nM) + VTP-50469 (100nM) treatment for 24 hours, normalized to DMSO. Data are represented as mean + SD of experimental triplicates in the human MLL::AF9-FKBP12 system, measured by SYBR green.
F. Relative expression of MEIS1 and HOXA7 in MLL::AF9-HA-FKBP12 human cells, normalized to DMSO. Data are represented as mean + SD of three independent experiments, measured by Taqman.
G. Relative expression of Meis1 and HoxA9 in MLL::AF9-HA-FKBP12 murine cells, normalized to DMSO treatment. Data are represented as mean + SD of three independent experiments, measured by Taqman.
H. Relative expression of MEIS1 and HOXA7 in MOLM13 cells, normalized to DMSO treatment. Data are represented as mean + SD of three independent experiments, measured by Taqman.
I. Venn diagrams of RNA-Seq from human MLL::AF9-FKBP12 cells depicting the overlap of genes with increased or decreased transcription (FC>2, p<0.05, Table S3) following treatment with EPZ-5676 (250nM, green), VTP-50469 (100nM, blue), EPZ-5676 (250nM) + VTP-50469 (100nM, orange) or dTAG-VHL (500nM, red) at the indicated timepoints.
