
Fig. 4.
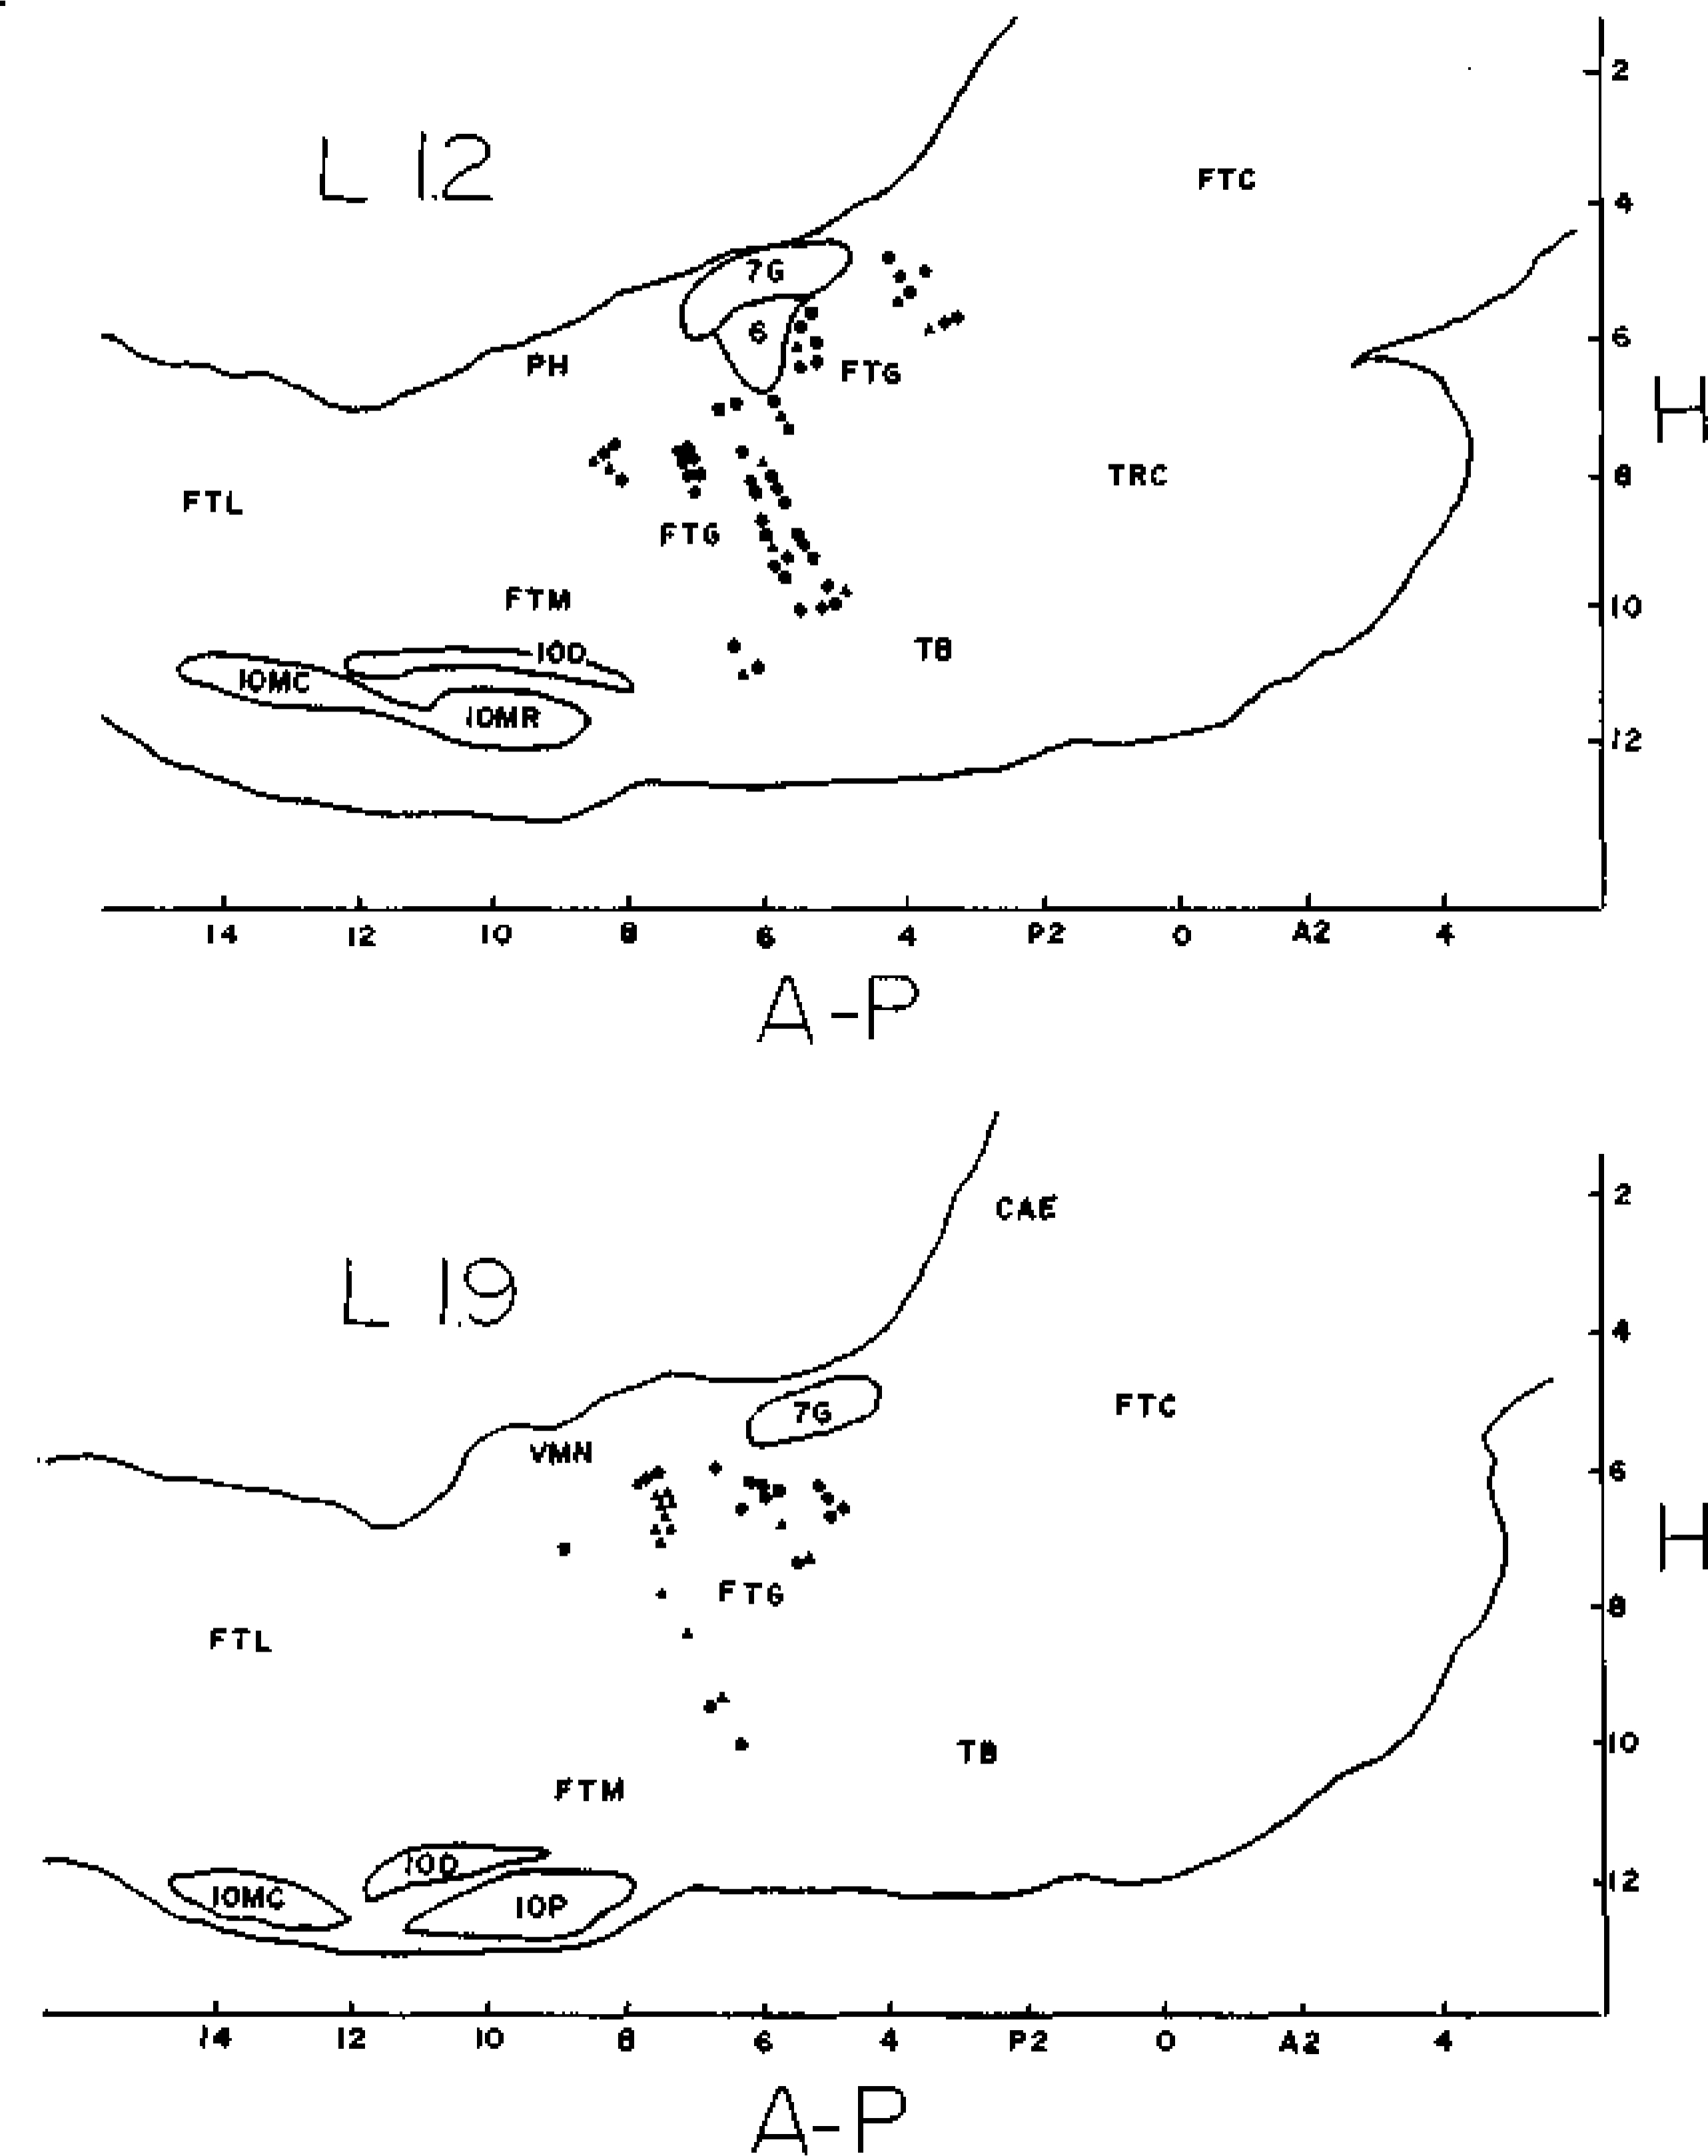
Stereotaxic positions of FTG cells mapped on sagittal sections 1.2 (top) or 1.9 (bottom) mm lateral to the midline. Type 1 cells are represented by triangles, type 2 by squares, and type 3 by circles. A-P— millimeters anterior or posterior to stereotaxic zero, H—millimeters ventral to Stereotaxic zero, 6—abducens nucleus, 7G— genu of the facial nerve, CAE—nucleus coeruleus, FTC—central tegmental field, FTG—gigantocellular tegmental field, FTL—lateral tegmental field, FTM—magno-cellular tegmental field, IOD—dorsal accessory nucleus of the inferior olive, IOMC— medial accessory nucleus of the inferior olive, caudal division, IOMR—medial accessory nucleus of the inferior olive, rostral division, IOP—principal nucleus of the inferior olive, PH—nucleus praepositus hypoglossi, TB—trapezoid body, TRC—tegmental reticular nucleus, central division, VMN—medial vestibular nucleus. to that of the maximum waking rates was 0.41. Comparison of the geometric mean of average REM rates with that of the minimum waking rates would produce a selectivity ratio of 120.15.