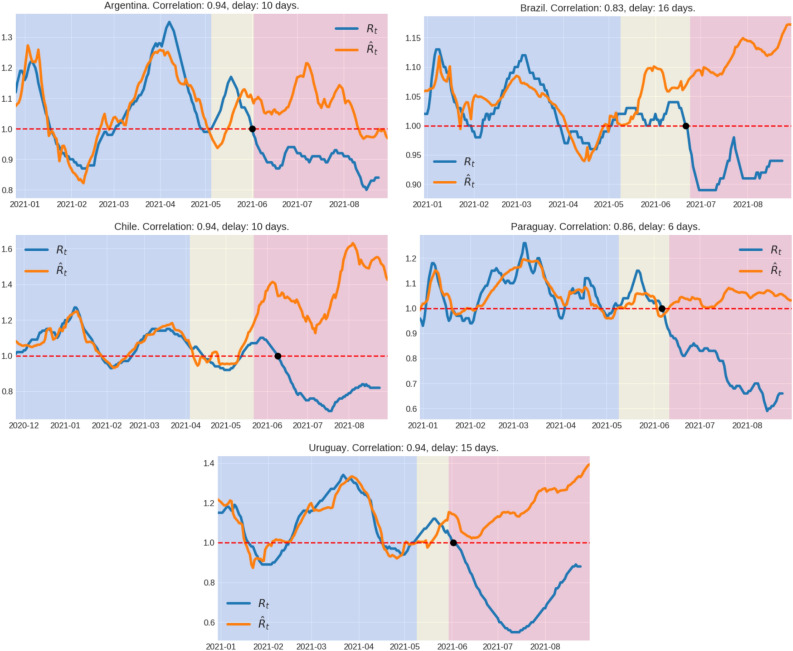
Figure 1.
Temporal variation of viral effective reproduction number estimated from daily SARS-CoV-2 incidence data () and population mobility data (). Background colors indicate the following time periods: in blue, the time period used to fit the linear model (see “Estimation of the viral effective reproduction number and decoupling time” section), in yellow, the period after the fitting, but before the decoupling time, and in red after the decoupling point. The black dot corresponds to the last time the was above one. The correlation corresponds to the period used to fit the model. The delay indicated is the time-shift between and in order to maximize their correlation in the linear regression.

