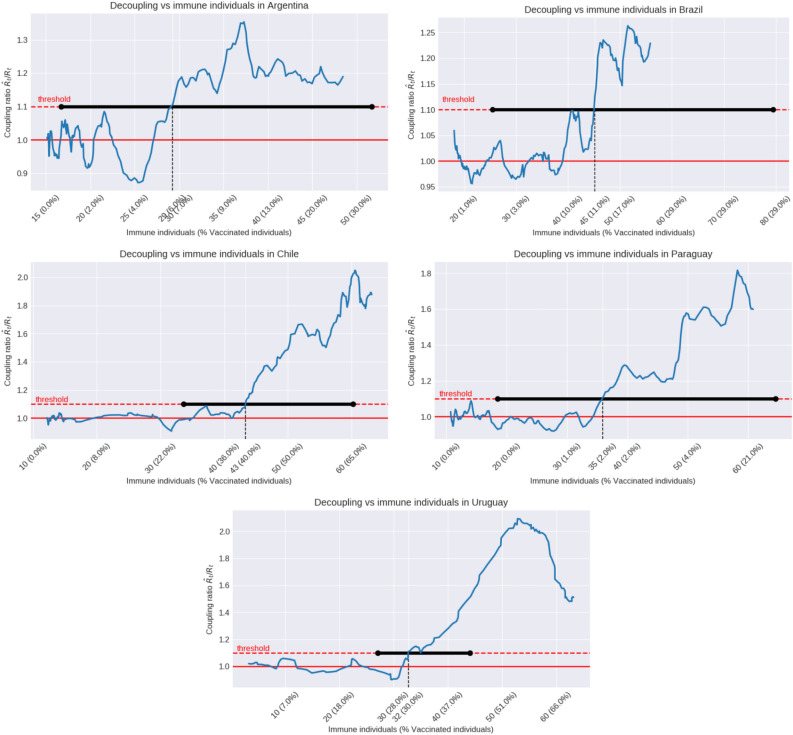
Figure 2.
Coupling ratio plotted with respect to the estimated percentage of immune population. During the first months of 2021 the coupling ratio varies around 1, which corresponds to the periods where the and are in concordance in Fig. 1. Immune population includes immunity achieved by vaccination (taking into account its effectiveness) and natural infection (see “Estimation of the IFR and immune population” section). The percentage of people fully vaccinated is described as well. The coupling ratio crosses the threshold (decoupling point) at percentages of immune population that varies along the five countries from 29% in Argentina to 33% in Uruguay, 37% in Paraguay, 43% in Chile and 45% in Brazil. Confidence intervals are shown in horizontal black lines. They inherit the large uncertainty in the IFR estimation (see Table 1).

