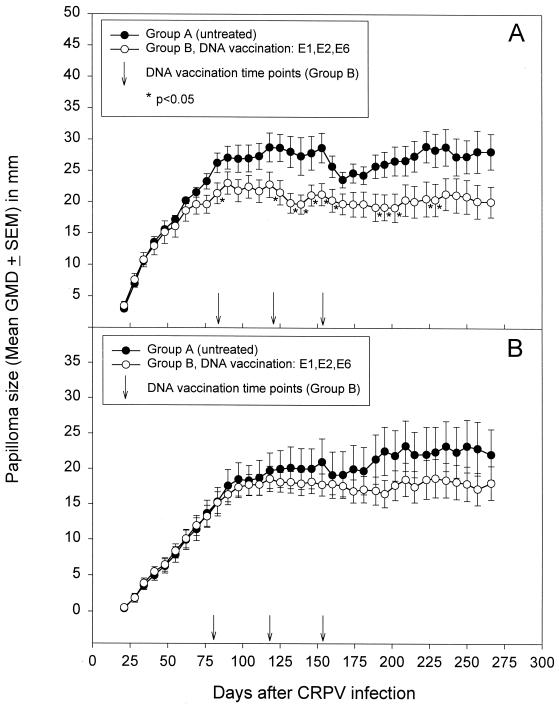
FIG. 1.
Sizes of CRPV-induced rabbit papillomas initiated with 10−1 (A) or 10−2 (B) dilutions of CRPV extract plotted against time (in days) after infection. Each point represent the mean ± SEM of GMDs for a total of 10 papillomas per group per virus dose. Groups included rabbits without treatment (group A) versus rabbits receiving three DNA vaccinations with CRPV E1 plus E2 plus E6 expression constructs. Between-group mean papilloma sizes were compared over time using Student's t test.

