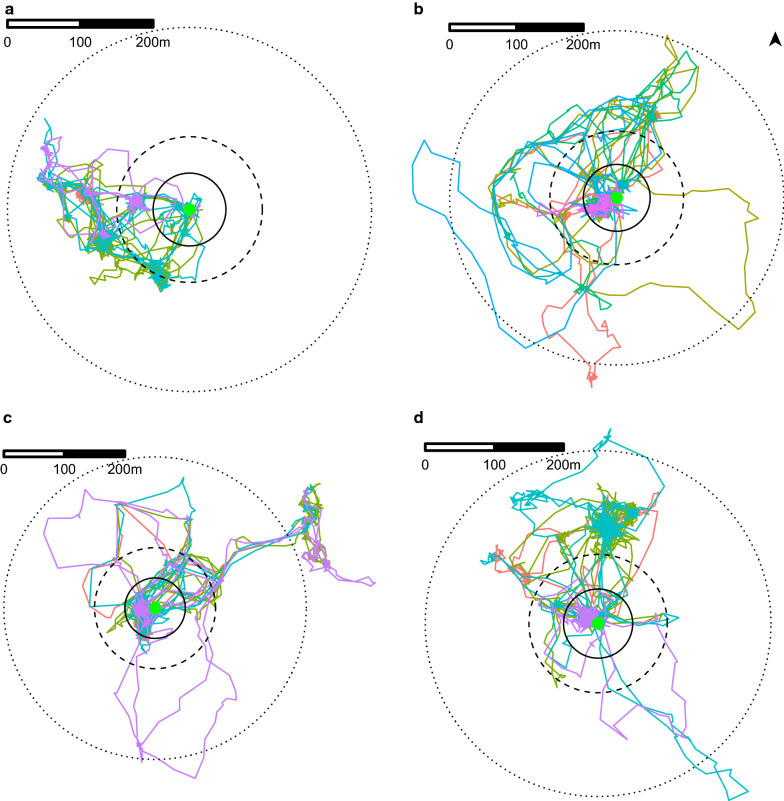
Fig. 1.
Visualization of tracking results for four different pigs (a–d). The circles represent rings around the pig-owning household (green central point), with the inner circle representing the ring with radius 50 m ring, the middle circle represent the ring with radius 100 m and the outer circle representing the ring with radius 250 m. a Pig spent 88, 55 and 0% of its time outside the 50-, 100- and 250-m rings, respectively. b Pig spent 19, 15 and 1% of its time outside the 50-, 100- and 250-m rings, respectively. c Pig spent 22, 16 and 11% of its time outside the 50-, 100- and 250-m rings, respectively. d Pig spent 73, 68 and 1% of its time outside the 50-, 100- and 250-m rings, respectively. Each color represents a different day

