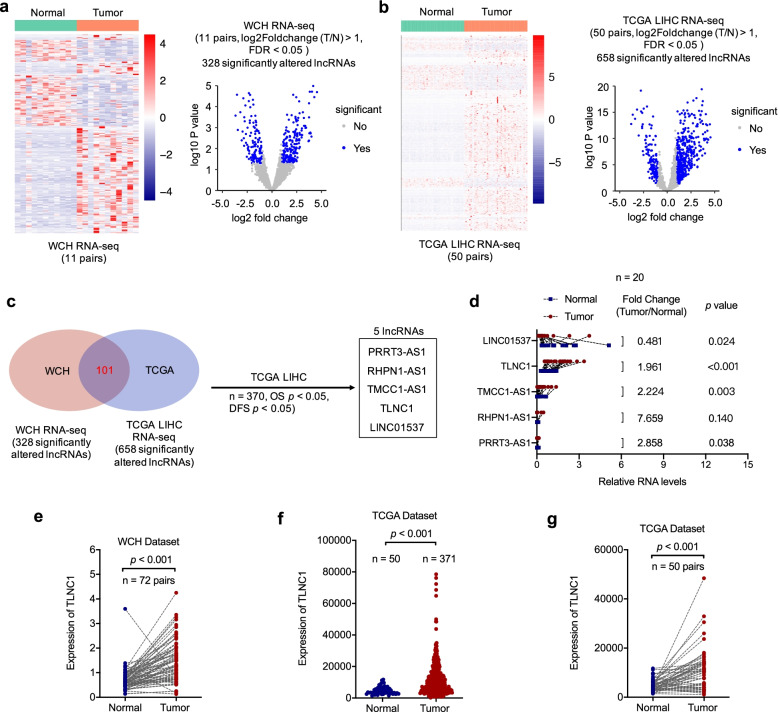
Fig. 1.
TLNC1 is upregulated in liver cancer tissues. a Clustering and volcano plot of differential lncRNA profiles between liver cancer tissues and adjacent normal tissues of west china hospital (WCH) cohort (n = 11). b Clustering and volcano plot of differential lncRNA profiles between liver cancer tissues and adjacent normal tissues of TCGA LIHC cohort (n = 50). c Venn plot shows the overlapping between differentially expressed lncRNAs of WCH and TCGA cohorts. The box indicates the differentially expressed lncRNAs that are correlated with OS and DFS of liver cancer patients according to the TCGA LIHC dataset. d Results from qRT-PCR validating the expression levels of 5 lncRNAs in 20 paired liver cancer and normal tissues. e Quantification of TLNC1 expression in 72 paired liver cancer and normal tissues of WCH cohort. f Quantification of TLNC1 expression in liver cancer tissues (n = 371) and normal tissues (n = 50) of TCGA LIHC cohort. g Quantification of TLNC1 expression in 50 paired liver cancer and normal tissues of TCGA LIHC cohort

