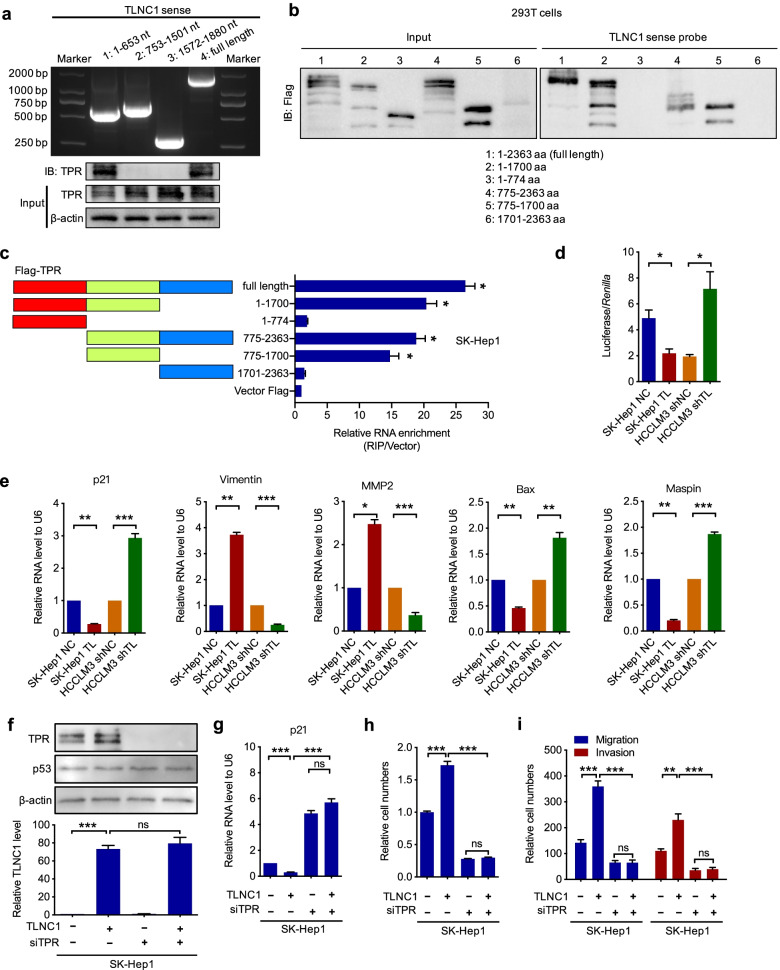
Fig. 5.
TLNC1 interacts with TPR and represses the transcriptional activity of p53. a Validation of nucleotide sequences in TLNC1 that bind to TPR. Upper panel, nucleotide electrophoresis showing the sizes of full-length and truncated TLNC1. Lower panel, immunoblot analysis of TPR in protein samples pulled down by full-length or truncated TLNC1. b Immunoblotting of the full-length or truncated Flag-TPR in the lysates from 293 T cells transfected with the indicated vectors, or in the retrieved proteins by the biotinylated TLNC1 probe from the lysates of 293 T cells transfected with the indicated vectors. c Validation of amino acid sequences in TPR that bind to TLNC1. Left panel, diagrams of full-length and truncated Flag-TPR. Right panel, qRT-PCR analysis after RIP assays of SK-Hep1 cells transfected with full-length and truncated Flag-TPR. d Dual luciferase assays for SK-Hep1 cells transfected with control or TLNC1 vectors and HCCLM3 cells transfected with control shRNA or shRNA targeting TLNC1. e qRT-PCR analysis for the expression of downstream targets of p53 signaling in indicated SK-Hep1 (TLNC1 overexpression) and HCCLM3 (TLNC1 knockdown) cells. f Above, immunoblot analysis of TPR and p53 in indicated SK-Hep1 cells treated with or without siTPR. Below, qRT-PCR detection of TLNC1 in indicated SK-Hep1 cells treated with or without siTPR. g qRT-PCR analysis for the expression of p21 in indicated SK-Hep1 cells. h Cell viability of indicated SK-Hep1 cells was measured by CCK-8 assay at 5 days post seeding. i Cell migration and invasion of indicated SK-Hep1 cells were measured by transwell migration and matrigel invasion assays, respectively. The data are the means ± SEM and are representative of three independent experiments. *p < 0.05, **p < 0.01, ***p < 0.001

