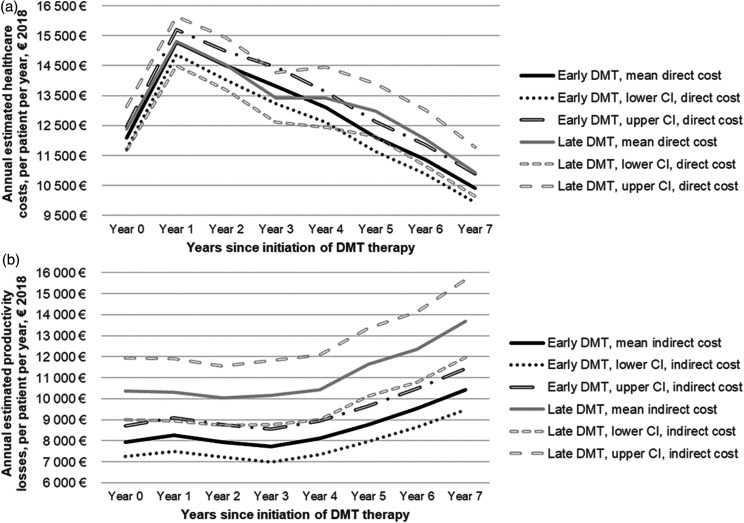
Figure 2.
(a, b) COI progression (estimated mean from the regressions) from baseline (index year) to the end of follow-up, by early vs. late treatment groups, adjusted for disability progression (mean annual EDSS score for each group) during the follow-up A) Healthcare costs. B) Productivity losses.

