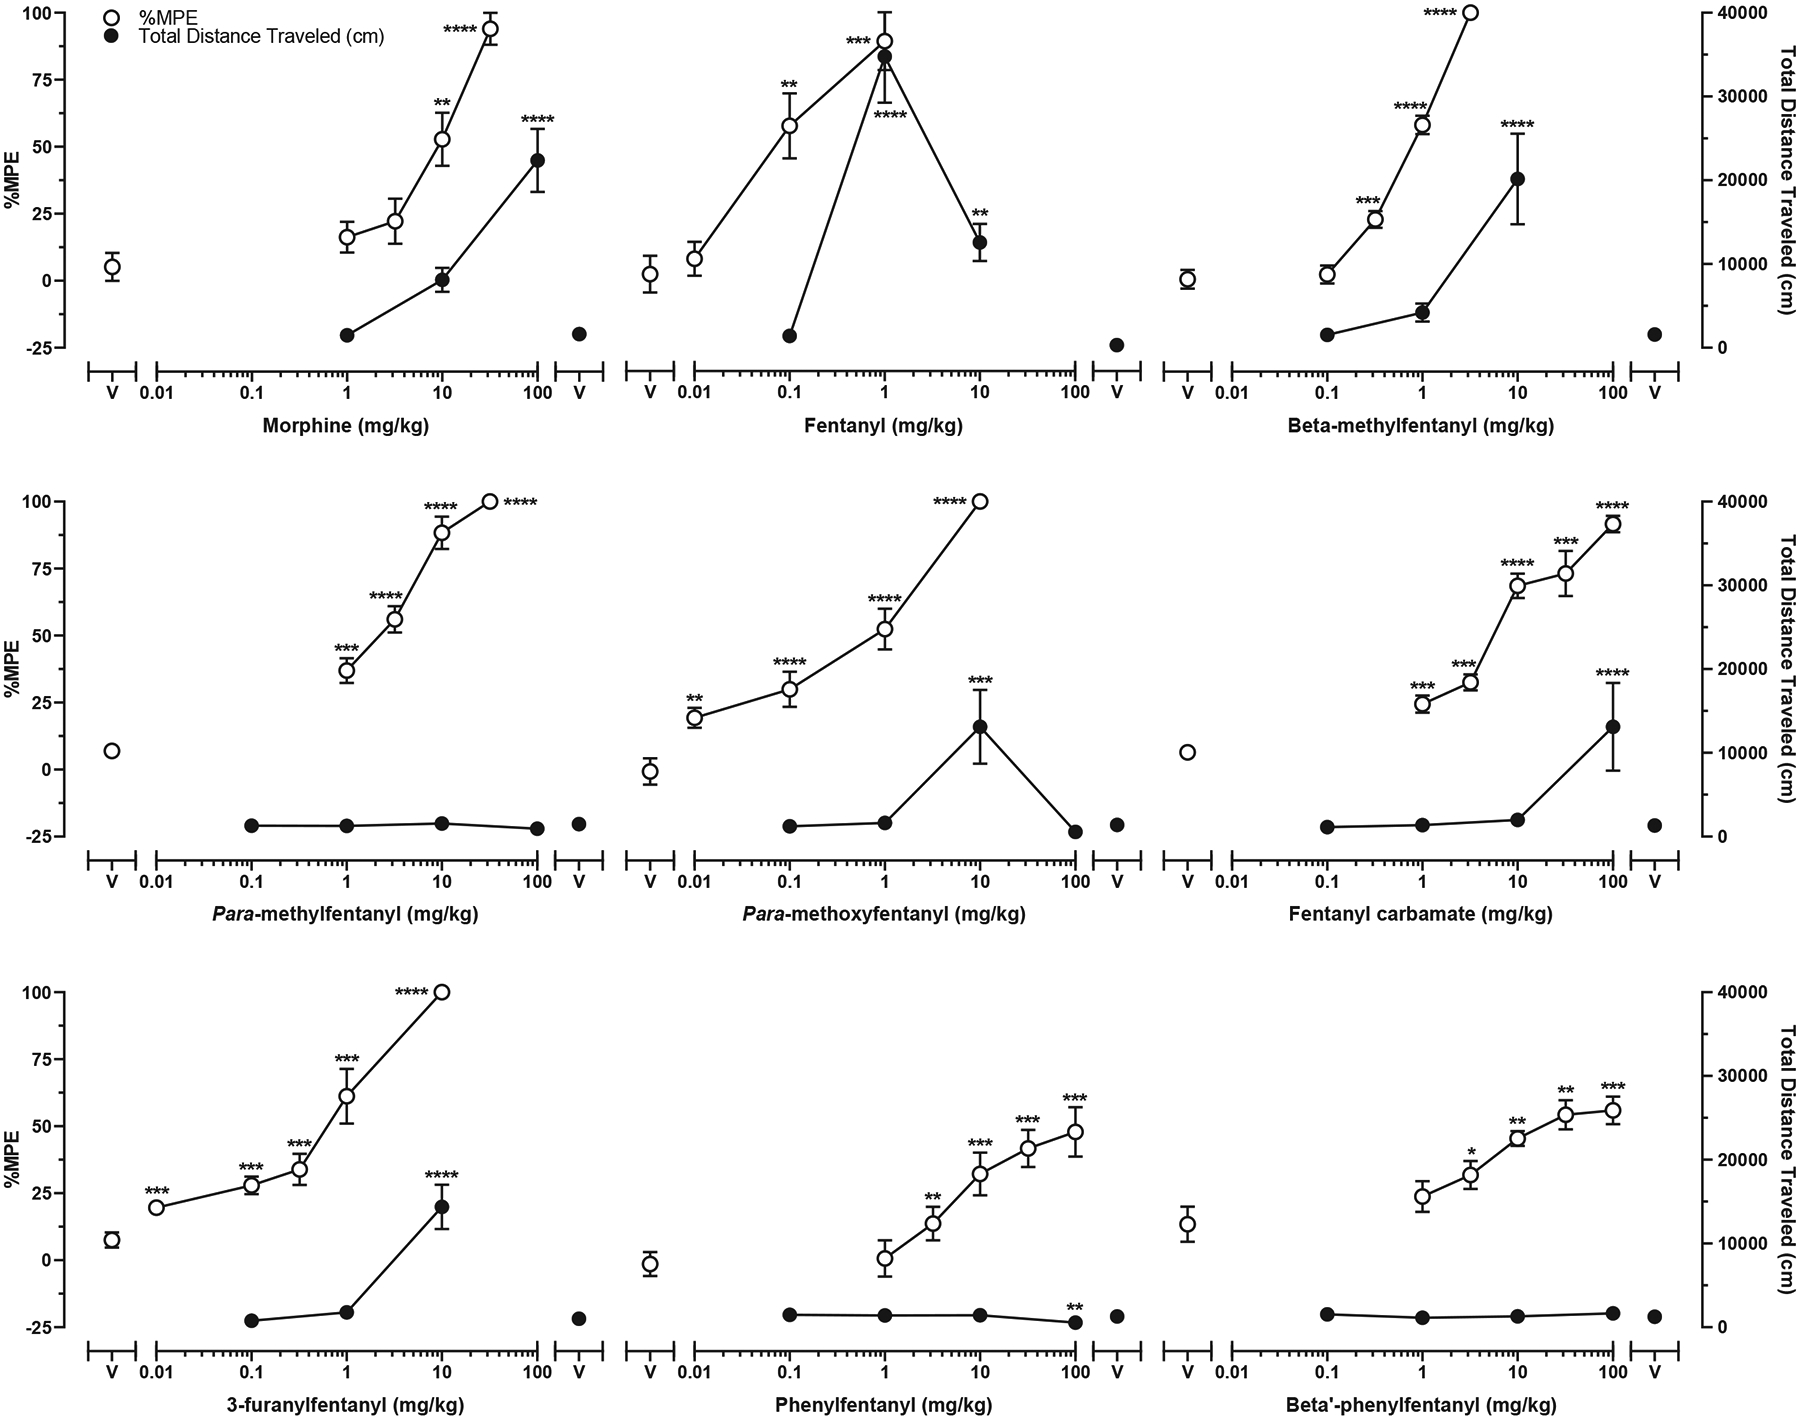
Fig. 4.

Cumulative dose effects in warm-water tail-withdrawal tests (open circles, left ordinate) and acute dose effects in locomotor activity tests (filled symbols, right ordinate). Symbols above “V” represent data from saline + vehicle conditions in warm-water tail-withdrawal tests and data from vehicle conditions in locomotor activity tests. Symbols representing data from warm-water tail-withdrawal tests are the mean (± SEM) %MPE for n = 8 mice per dose. Symbols representing data from locomotor activity tests are the mean (± SEM) distance traveled (cm) for n = 8–16 mice per dose. Significant differences between drug and vehicle are indicated by asterisks: *p ≤ 0.05, **p ≤ 0.01, ***p ≤ 0.001, ****p ≤ 0.0001.
