Fig. 3.
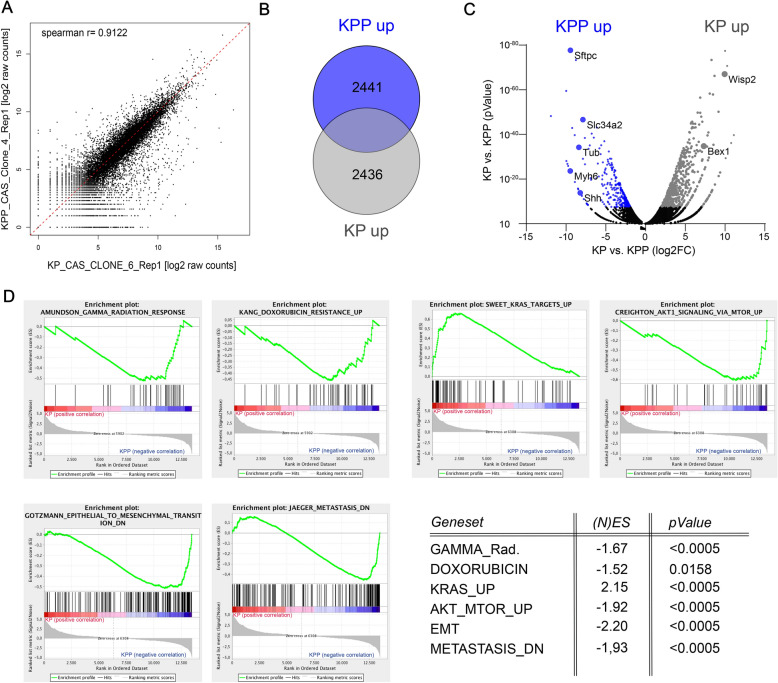
Loss of Pten alters DNA damage signalling pathways in murine NSCLC. A Correlation of gene expression changes of KRasG12D:Trp53 (KP6) relative to KRasG12D:Trp53:Pten (KPP4). The diagonal line reflects a regression build on a linear model. R: Pearsons correlation coefficient. R = 0.9122. B Venn diagram of differentially up-regulated genes (log2FC > 1.0 and q-value < 0.05) between KRasG12D:Trp53 (KP6) relative to KRasG12D:Trp53:Pten (KPP4). C Volcano blot of differentially up- and downregulated genes in KRasG12D:Trp53:Pten (KPP4) relative to KRasG12D:Trp53 (KP6).log2FCcut-off > 1.0, −log10FC > 1.5. Highlighted are genes involved in IR resistance; SftpC, Slc34a2, Tub, Myh6 and Shh, or IR sensitivity, Wisp2 and Bex1. n = 3. D Gene set enrichment analysis (GSEA) of Gamma radiation response, doxorubicin resistance up, KRas targets up, AKT1 signaling via mTOR, mesenchymal transition and metastasis KRasG12D:Trp53 (KP) relative to KRasG12D:Trp53:Pten (KPP). n = 3 each. Table with normalized enrichment score ((N)ES) and p-value of GSEA. Also see Additional file 1: Fig. S3

