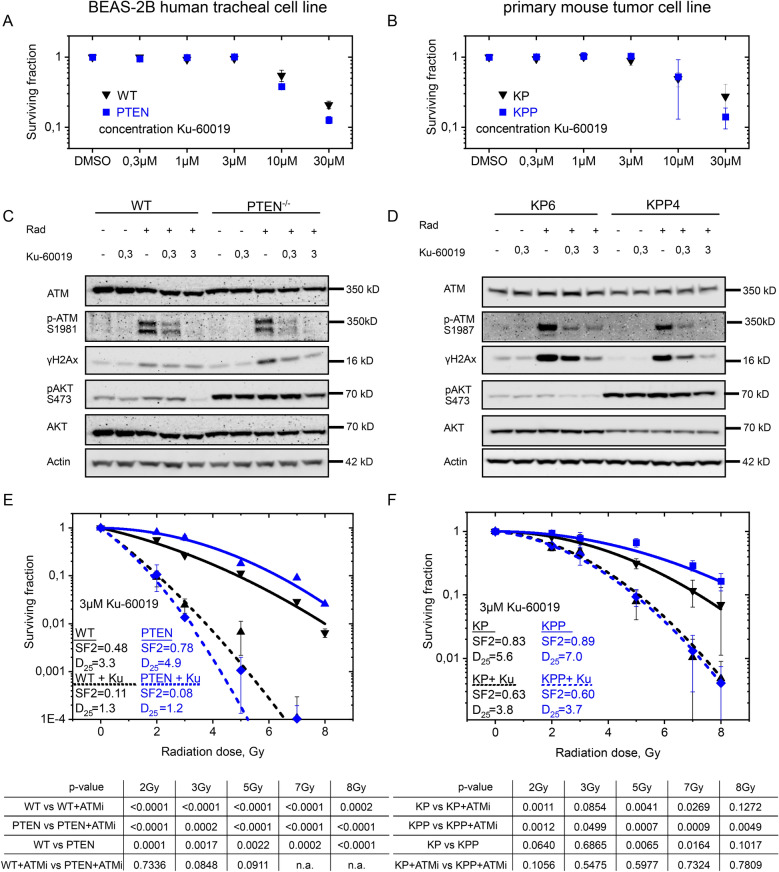
Fig. 5.
Impact of ATM inhibition in PTEN deficient cells. A Dose response of BEAS-2B WT (black) and BEAS-2B PTENhomo (blue) BEAS-2B cells on colony forming ability following treatment with KU-60019 in different concentrations. Error bars: Standard deviation. n = 3. B Dose response of murine PTEN proficient KP6 (black) and PTEN deficient KPP4 cells on colony forming ability following treatment with KU-60019 in different concentrations. Error bars: Standard deviation. n = 3. C Immunoblot of WT and PTEN deficient BEAS-2B cells 30 min after irradiation with 8 Gy and 3 h pre-treatment with 0.3 µM and 3 µM KU-60019 before irradiation. DMSO as solvent control. Actin, ATM and AKT as loading control. n = 3. D Immunoblot of murine PTEN proficient KP6 and PTEN deficient KPP4 cells 30 min after irradiation with 8 Gy and 3 h pre-treatment with 0.3 µM and 3 µM KU-60019 before irradiation. DMSO as solvent control. Actin, ATM and AKT as loading control. n = 3. E Colony formation assay of WT (black) and PTEN deficient (blue) BEAS-2B cells with 3 h pre-treatment of 3 µM KU-60019 (dashed lines) and DMSO as control (continuous lines) with 24 h re-seeding protocol (Additional file 1: Fig. S4A). SF 2: Surviving fraction at 2 Gy. D25: Dose in Gy with 25% survival. Error bars: Standard deviation. n = 3. F Colony formation assay of murine PTEN proficient KP6 (black) and PTEN deficient KPP4 cells with 3 h pre-treatment 3 µM KU-60019 (dashed lines) and DMSO as control (continuous lines) with re-seeding protocol (Additional file 1: Fig. S4A). SF 2: Surviving fraction at 2 Gy. D25: Dose in Gy with 25% survival. Error bars: Standard deviation. n = 3. Also see Additional file 1: Fig. S5

