Fig. 9.
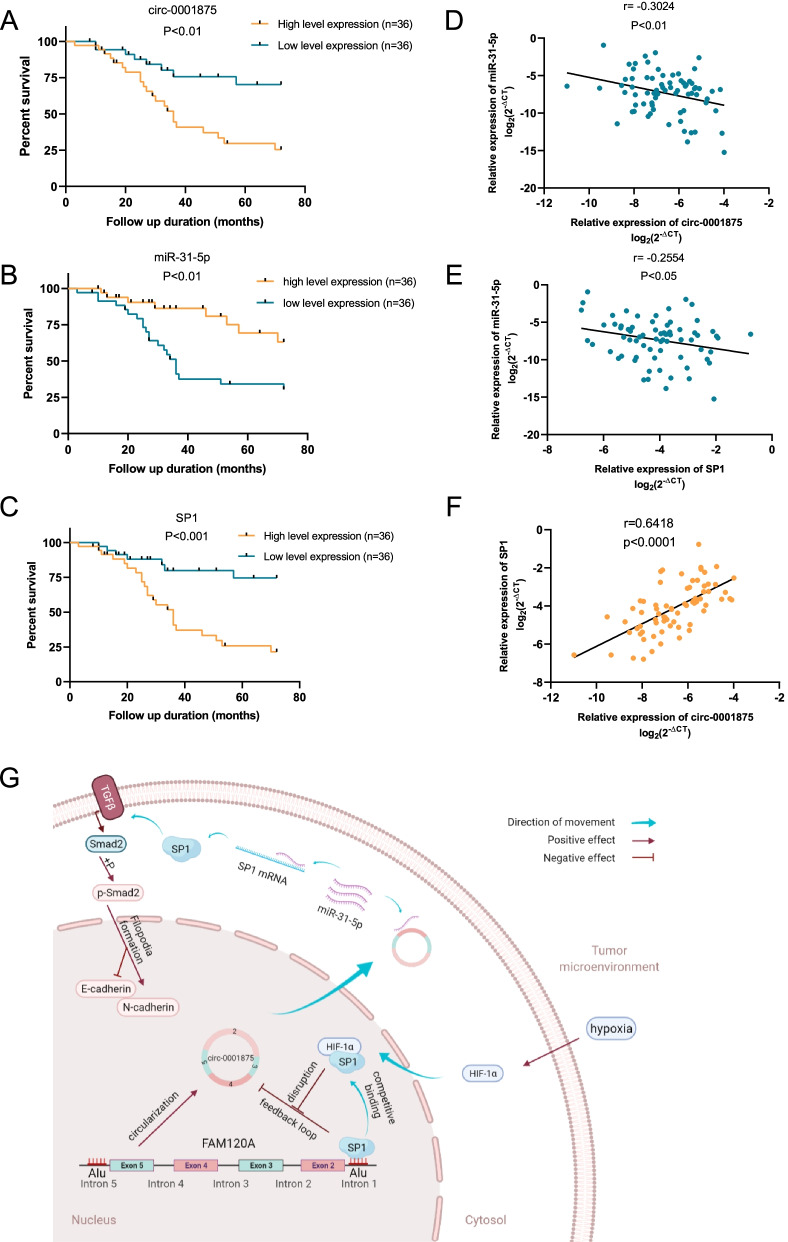
Circ_0001875/miR-31-5p/SP1 axis correlates with NSCLC prognosis and the schematic diagram illustrates the mechanism. a–c Kaplan–Meier survival curves showed the overall survival of NSCLC patients with low and high circ-0001875, miR-31-5p or SP1 expression (n = 72). d–f Correlation analysis between circ-0001875, miR-31-5p and SP1 expression analyzed by RT-qPCR in NSCLC tissues (n = 72). g Schematic diagram illustrates the mechanism by which the circ-0001875/miR-31-5p/SP1 and EMT axis promotes NSCLC proliferation and metastasis and negatively regulates by a SP1-AluSq-dependent feedback loop, but hypoxia-induced HIF1α-SP1 interaction disrupts the circ-0001875/miR-31-5p/SP1/AluSq feedback loop. The schematic diagram was elaborated by BioRender. Data are shown as the means ± SD. *p < 0.05, **p < 0.01, ***p < 0.001

