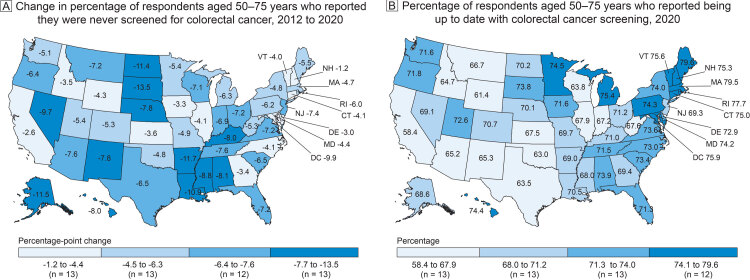
Colorectal cancer screening among US adults aged 50–75 years, Behavioral Risk Factor Surveillance System, 2012 and 2020. A, Change in percentage of US adults aged 50–75 years who reported they were never screened for colorectal cancer, 2012 to 2020. The overall decrease in never screened in the US was −5.8 percentage points. B, Percentage of US adults aged 50–75 years who reported being up to date with colorectal cancer screening in 2020. The percentage up to date in the US overall was 69.4%. Percentages were age-standardized to the 2000 US standard million population. Data source: Centers for Disease Control and Prevention, Behavioral Risk Factor Surveillance System (1,2).
| State | Map A. Percentage of adults aged 50–75 years who were never screened in 2020 minus the percentage never screened in 2012 | Map B. Percentage of adults aged 50–75 years who reported being up to date with colorectal cancer screening in 2020 |
|---|---|---|
| Alabama | −8.1 | 73.9 |
| Alaska | −11.5 | 68.6 |
| Arizona | −7.6 | 65.2 |
| Arkansas | −11.7 | 69.0 |
| California | −2.6 | 58.4 |
| Colorado | −5.3 | 70.7 |
| Connecticut | −4.1 | 75.0 |
| Delaware | −3.0 | 72.9 |
| District of Columbia | −9.9 | 75.9 |
| Florida | −7.2 | 71.3 |
| Georgia | −3.4 | 69.4 |
| Hawaii | −8.0 | 74.4 |
| Idaho | −3.5 | 64.7 |
| Illinois | −4.1 | 67.9 |
| Indiana | −6.9 | 67.2 |
| Iowa | −3.3 | 71.6 |
| Kansas | −3.6 | 67.5 |
| Kentucky | −8.0 | 71.0 |
| Louisiana | −10.9 | 70.5 |
| Maine | −5.5 | 79.6 |
| Maryland | −4.4 | 74.2 |
| Massachusetts | −4.7 | 79.5 |
| Michigan | −6.3 | 75.4 |
| Minnesota | −5.4 | 74.5 |
| Mississippi | −8.8 | 68.0 |
| Missouri | −4.9 | 69.7 |
| Montana | −7.2 | 66.7 |
| Nebraska | −7.8 | 70.1 |
| Nevada | −9.7 | 69.1 |
| New Hampshire | −1.2 | 75.3 |
| New Jersey | −7.4 | 69.3 |
| New Mexico | −7.8 | 65.3 |
| New York | −4.8 | 74.0 |
| North Carolina | −4.1 | 73.0 |
| North Dakota | −11.4 | 70.2 |
| Ohio | −7.2 | 71.2 |
| Oklahoma | −4.8 | 63.0 |
| Oregon | −6.4 | 71.8 |
| Pennsylvania | −6.2 | 74.3 |
| Rhode Island | −6.0 | 77.7 |
| South Carolina | −6.5 | 73.4 |
| South Dakota | −13.5 | 73.8 |
| Tennessee | −7.6 | 71.5 |
| Texas | −6.5 | 63.5 |
| Utah | −5.4 | 72.6 |
| Vermont | −4.0 | 75.6 |
| Virginia | −7.2 | 73.6 |
| Washington | −5.1 | 71.6 |
| West Virginia | −5.3 | 67.6 |
| Wisconsin | −7.1 | 63.8 |
| Wyoming | −4.3 | 61.4 |

