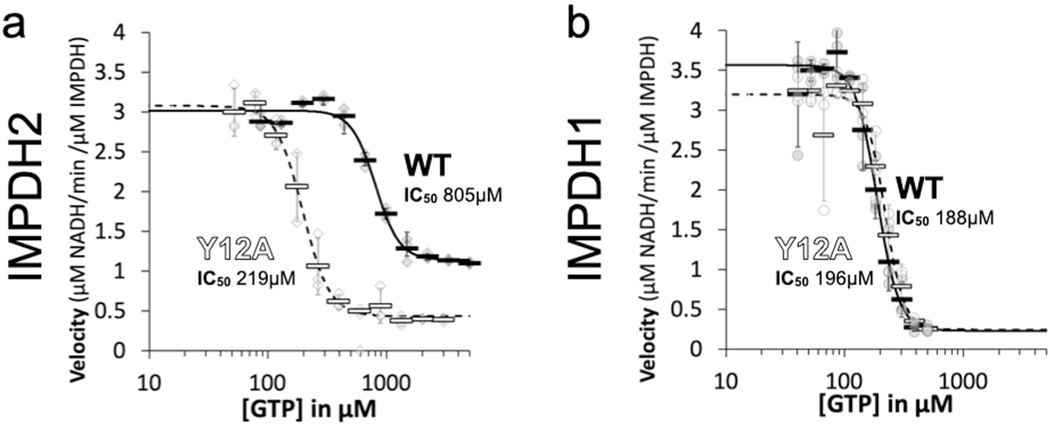
Extended Data Fig. 3 |. IMPDH2-Wt filament resists gtP inhibition.
a,b, GTP inhibition curves of IMPDH2 or IMPDH1-WT (solid line) and the respective non-assembly y12A protein (dashed line). Individual data points are shown as diamonds (IMPDH2) or circles (IMPDH1), where filled are WT and empty y12A. reactions were performed in triplicate and the average for each concentration is shown as a bold rectangle (filled is WT, empty is y12A). Error bars are standard deviation calculated from n = 3. reactions performed with 1 μM protein, 1 mM ATP, 1 mM IMP, 300 μM nAD+, and varying GTP.

