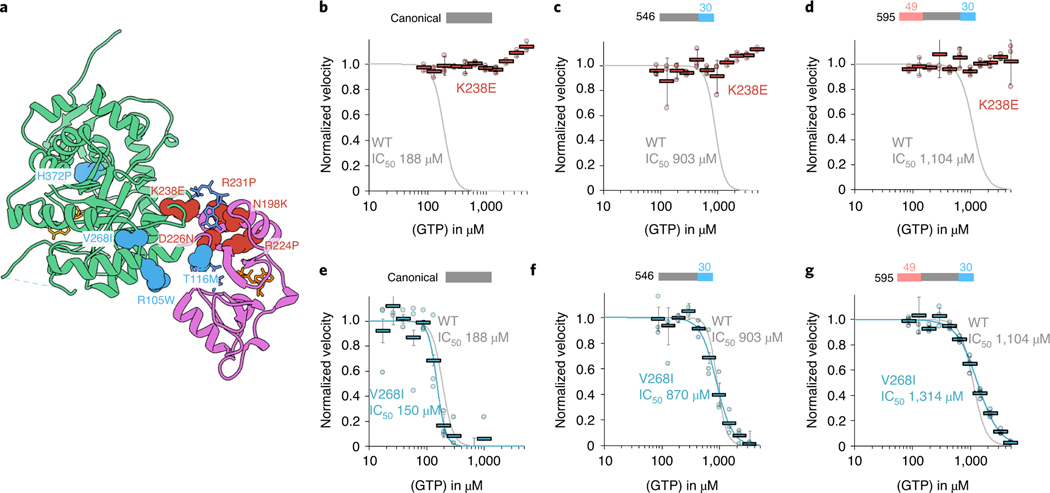
Fig. 6 |. IMPDH1 retinopathy mutations fall into two classes.
a, IMPDH1 with catalytic domain (green), regulatory domain (pink), NAD+ (gold), GTP (blue) and ATP (orange). Class I (defective in GTP regulation) residues colored coral. Class II residues (normal GTP regulation) colored teal. b–g, GTP inhibition curves of IMPDH1 retinopathy mutant variants (colored lines) compared to IMPDH1-WT variants (gray lines). reactions performed with 1 μM protein, 1 mM ATP, 1 mM IMP, 300 μM NAD+ and varying GTP. Individual data points for mutants are shown as circles. reactions were performed in triplicate and the average for each concentration is shown as a bold rectangle (gray WT, red K238E, teal V268I). Error bars show the standard deviation for n = 3. Individual data points and averages for WT are in Fig. 1d. b, Canonical IMPDH1(514)-K238E. c, retinal variant IMPDH1(546)-K238E. d, retinal variant IMPDH1(595)-K238E. e, Canonical IMPDH1(514)-V268I. f, retinal variant IMPDH1(546)-V268I. g, retinal variant IMPDH1(595)-V268I.

