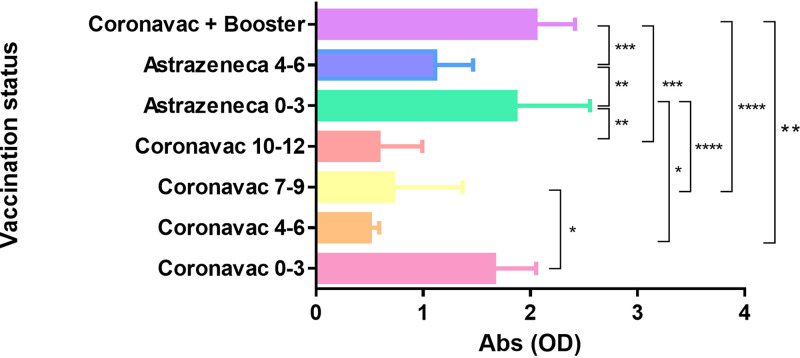
FIG 3.
Serum levels of specific antibodies (represented as optical densities [OD]) found after immunization regimens were compared by analysis of variance (ANOVA) followed by Bonferroni multiple-comparison test. The y axis shows immunization regimens, and the respective time after last dose is shown in months by numbers (0 to 3, 4 to 6, 7 to 9, and 10 to 12 months). The x axis shows absorbance as optical density values. Significance was set as P ≤ 0.05. *, P ≤ 0.05; **, P ≤ 0.01; ***, P ≤ 0.001; ****, P ≤ 0.0001.

