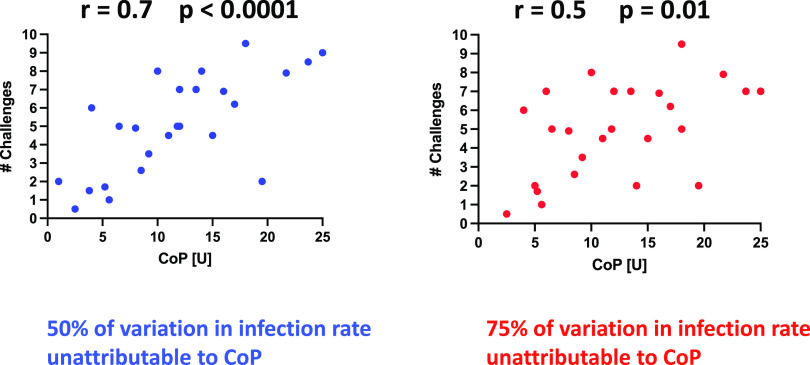
FIG 4.
Attributable proportion of variance in parametric correlations. The simulated animal model data have passed normality tests, which legitimizes parametric correlation analyses (Pearson). An advantage of Pearson correlations is that the coefficient squared corresponds to the fraction of the variance in the number of challenges required for infection that can be attributed to the variance in the CoP values. A Pearson correlation coefficient of r = 0.7 (left diagram) may seem impressive, but it nevertheless leaves 50% of the variation unattributed (note that even attributable to is not equivalent to caused by). Weaker correlations, say r = 0.5, are often reported (note that the attribution invokes correlation strength and not its significance, which can be high for a weak correlation). The unattributed portion of the variation would then be 75% (right diagram). Often parametric correlations are illegitimate because the distribution cannot pass normality tests. Nonparametric correlations are then justified but preclude the attribution of a proportion of the variation. Thus, in spite of highly significant (P < 0.0001 and P = 0.01) and robust (r = 0.7 and r = 0.5) correlations, the extent of protection that can be attributed to the variation in a proposed mCoP may be small (50% in the left diagram and 25% in the right diagram) or even unknown when the correlations are nonparametric.

