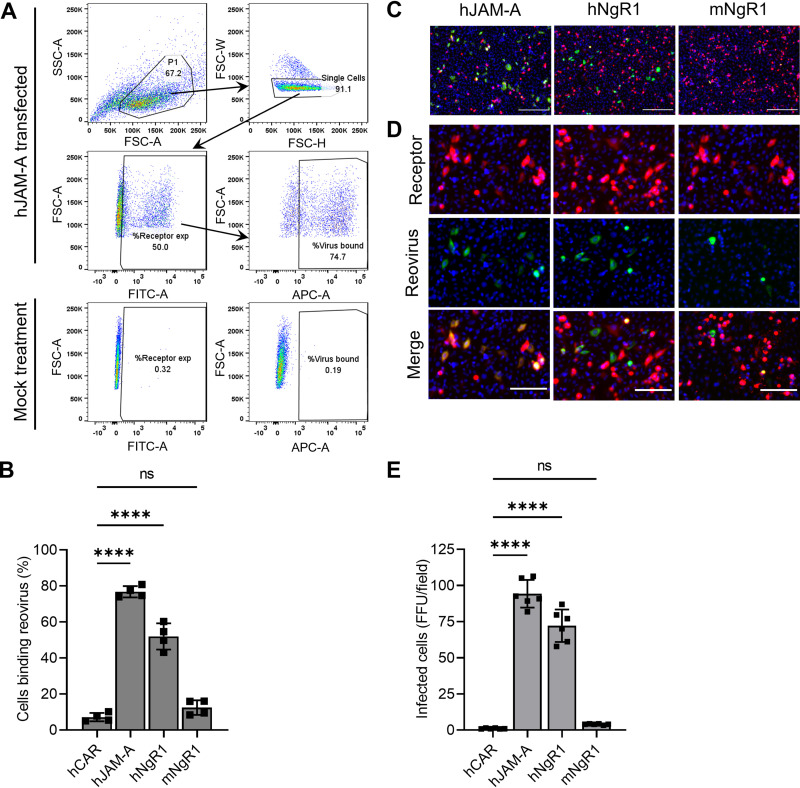
FIG 6.
Murine NgR1 does not serve as an efficient reovirus receptor. (A and B) CHO cells were transfected with plasmids encoding the receptors shown and incubated with 105 particles/cell of fluorescently labeled reovirus T3SA− at 4°C for 1 h. Unbound virus was removed, and cells were fixed using paraformaldehyde and stained with receptor-specific antibodies to determine expression. The percentage of receptor-expressing cells bound by reovirus was quantified using flow cytometry. (A) Representative gating strategy for flow cytometry data analysis is shown for hJAM-A-transfected cells. Single cells identified based on scatter profiles were gated for receptor expression. Receptor-expressing cells were then gated for reovirus binding. Gates were defined based on mock-treated controls (bottom panels). Mock-treated samples were not treated with receptor-specific antibodies or reovirus. (B) Results are expressed as the mean percentage of reovirus-bound cells from duplicate samples of two independent experiments. The mean percentage of transfected cells expressing cell-surface receptors was 91% for hCAR, 54% for hJAM-A, 80% for hNgR1, and 85% for mNgR1. Error bars indicate SEM. ns, not significant (P > 0.05); ****, P < 0.0001 (one-way ANOVA with Dunnett’s multiple-comparison test). (C to E) Transfected CHO cells were adsorbed with 30 PFU/cell of T3SA− at 4°C for 1 h. Infectivity was quantified at 24 h post-adsorption. (C) Representative micrographs display nuclei stained with DAPI (blue), receptor expression (red), and reovirus antigen staining (green). Bars, 200 μm. (D) Enlarged versions of images in panel C show individual channels stained for receptor expression or reovirus antigen along with DAPI. Bars, 100 μm. (E) Mean numbers of infected cells per field-of-view from three independent experiments, each including duplicate samples. For each sample, FFU in 8 to 9 fields-of-view were averaged and presented as a single data point. Error bars indicate SEM. ns, not significant (P > 0.05); ****, P < 0.0001 (one-way ANOVA with Dunnett’s multiple-comparison test).

