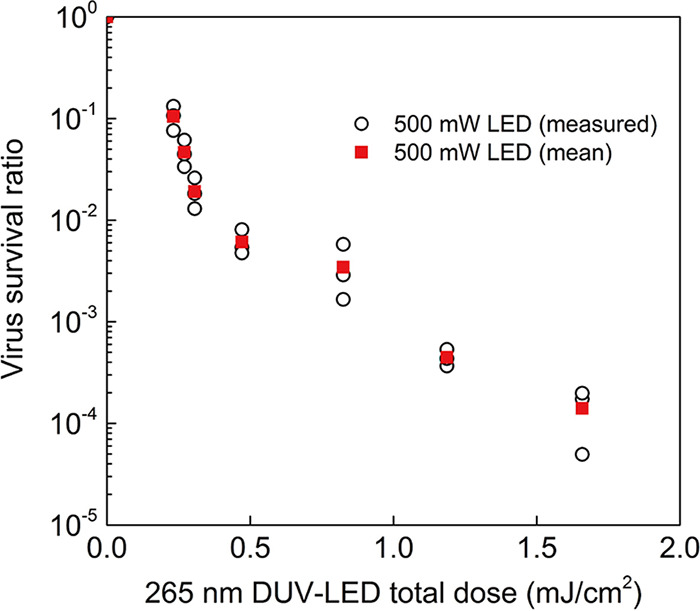
FIG 4.

DUV-LED inactivation of SARS-CoV-2 aerosol. White circles indicate values measured for each experiment (n = 3) when using the high-power 500-mW DUV-LED, and red squares indicate the mean values. Significant differences were observed in each irradiated group compared to the nonirradiated group (P < 0.05).
