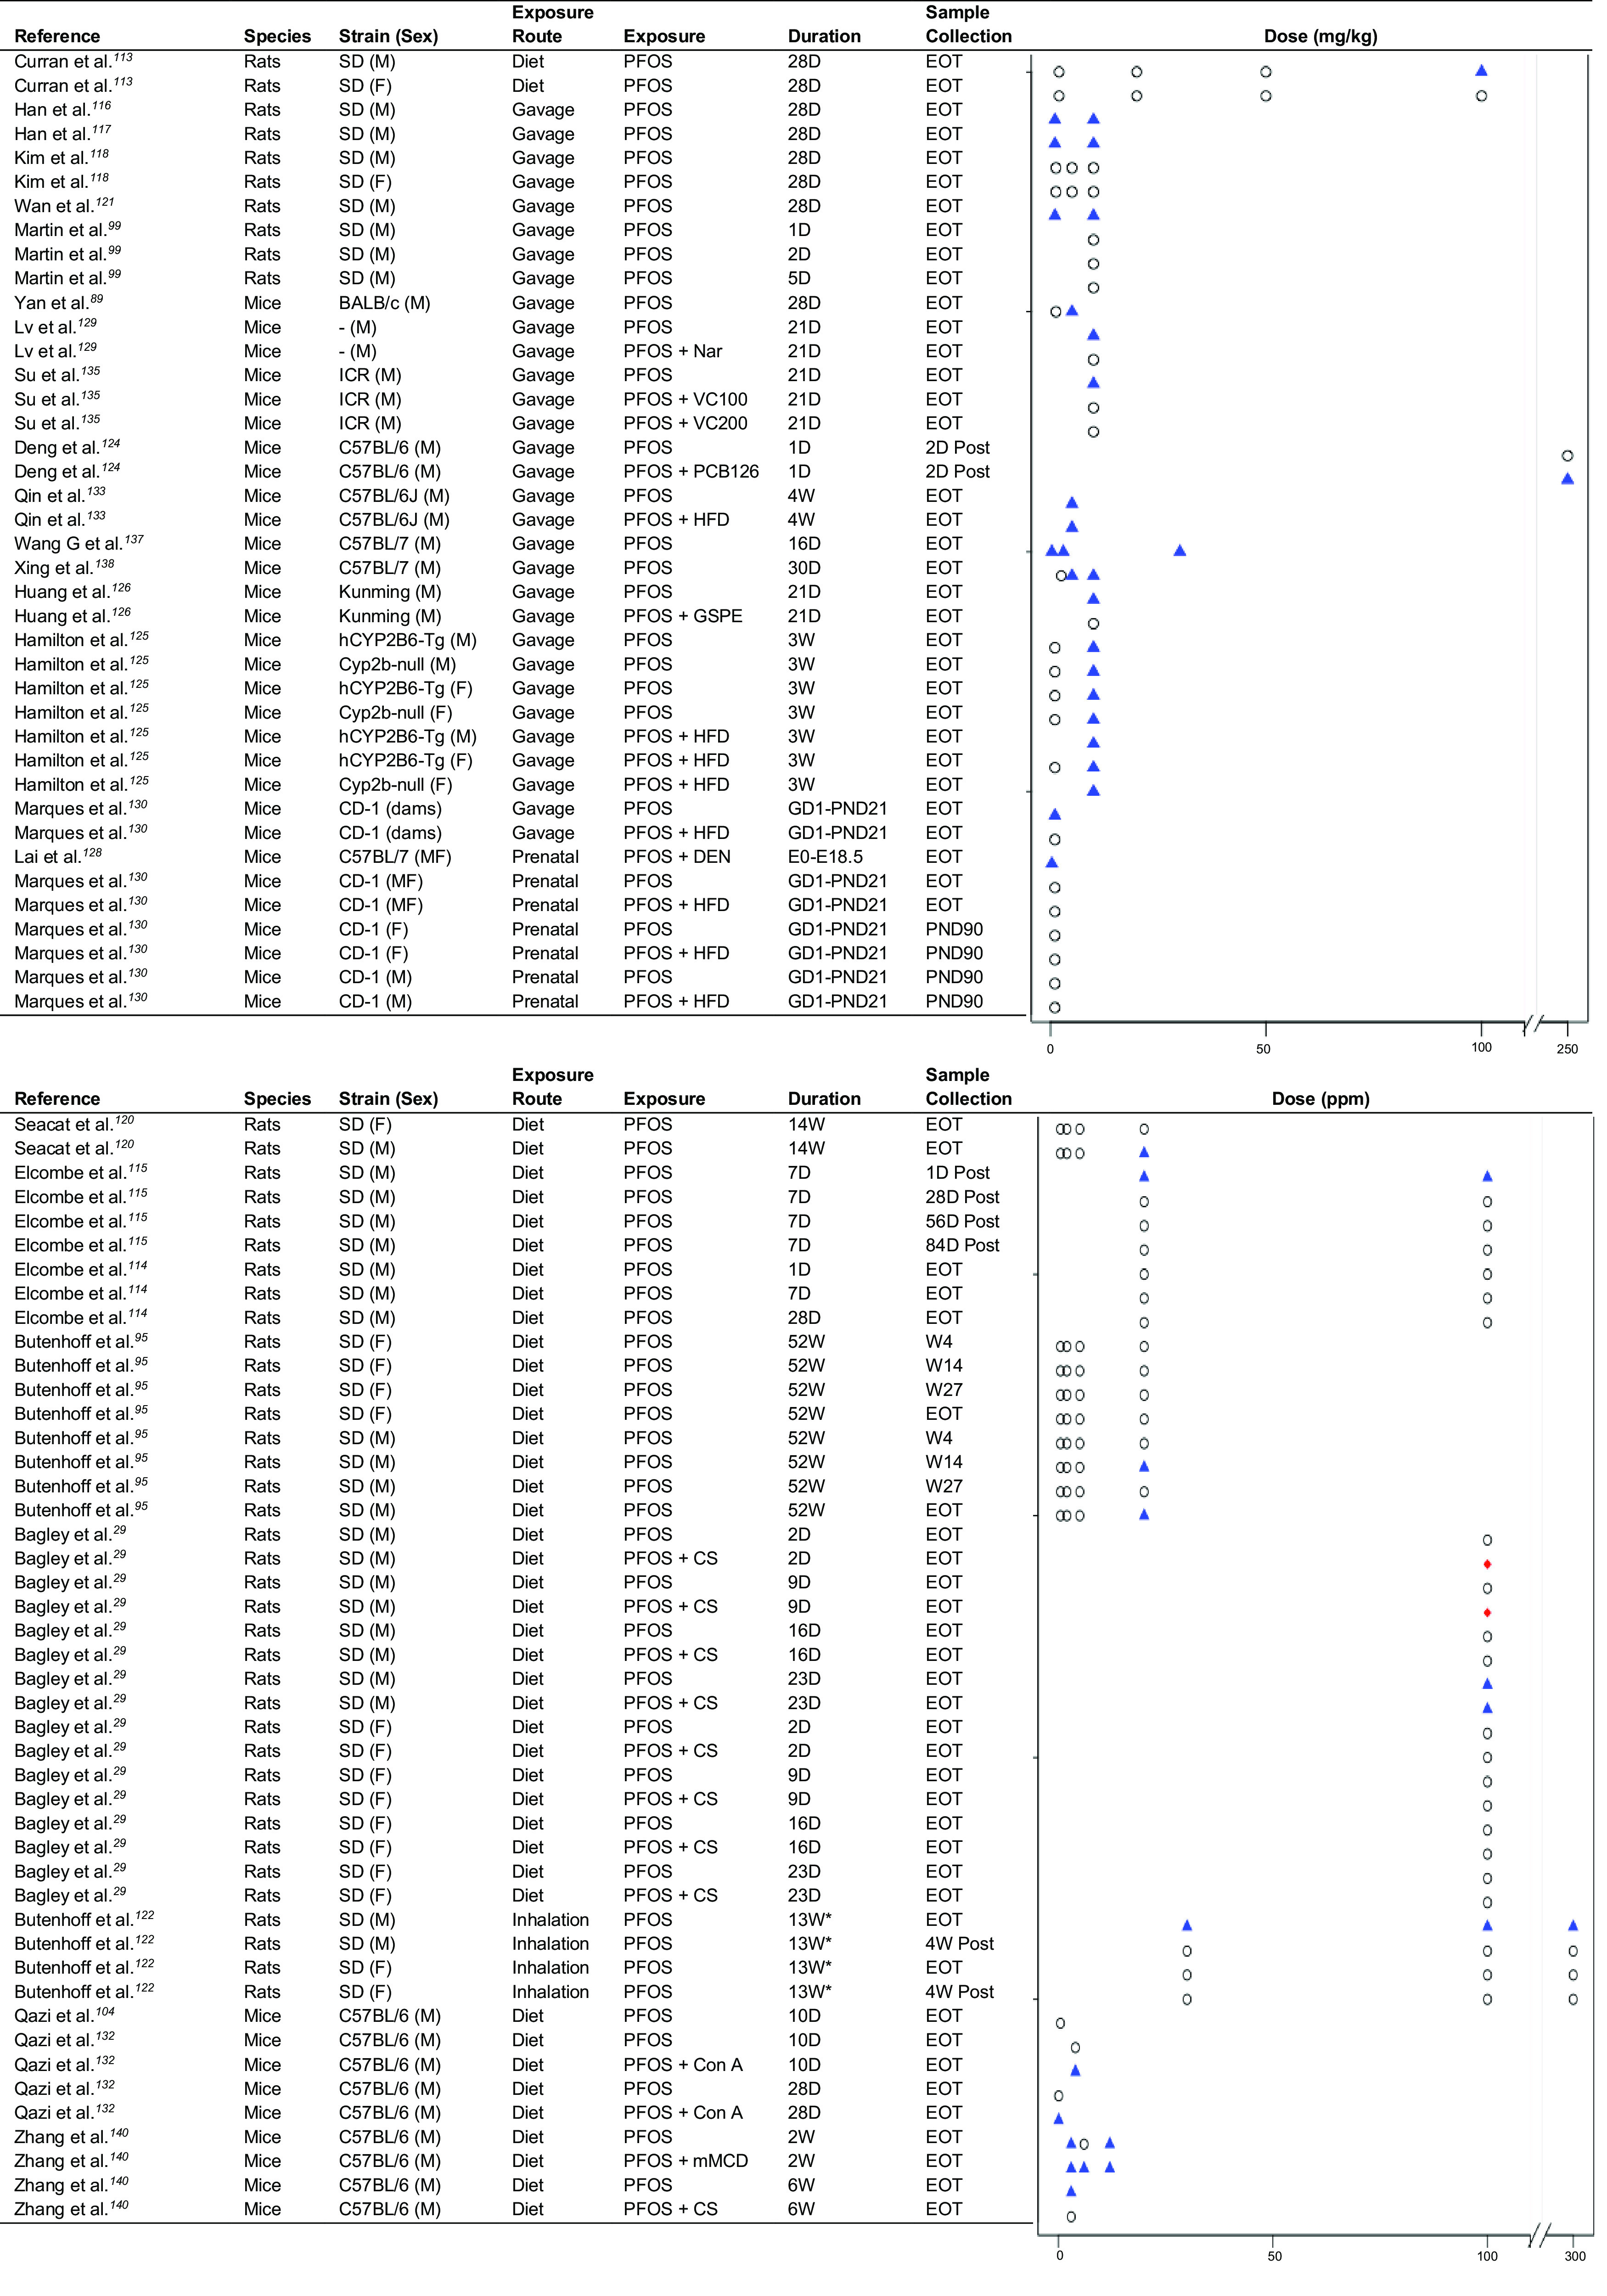
Figure 3.

Strip plots for PFOS and ALT in rodent studies. Triangles indicate a significant increase in ALT relative to control. Diamonds indicate a significant decrease in ALT relative to control. Circles indicate no significant change in ALT relative to control. Plots are ordered by species and strain. In the study by Butenhoff et al.122, atmospheric exposure occurred for 5 h/d, 5 d/wk. An accessible version of this figure is available in Table S6. Note: ALT, alanine aminotransferase; CS, choline supplementation; Con A, concanavalin A; D, day; DEN, diethylnitrosamine; EOT, end of treatment; F, female; GD, gestational day; GSPE, grape seed proanthocyanidin extract; HFD, high-fat diet; M, male; mMCD, marginal methionine/choline-deficient diet; Nar, naringin; PCB, polychlorinated biphenyl; PFOS, perfluorooctanesulfonic acid; PND, postnatal day; SD, Sprague Dawley; VC, vitamin C; W, week.
