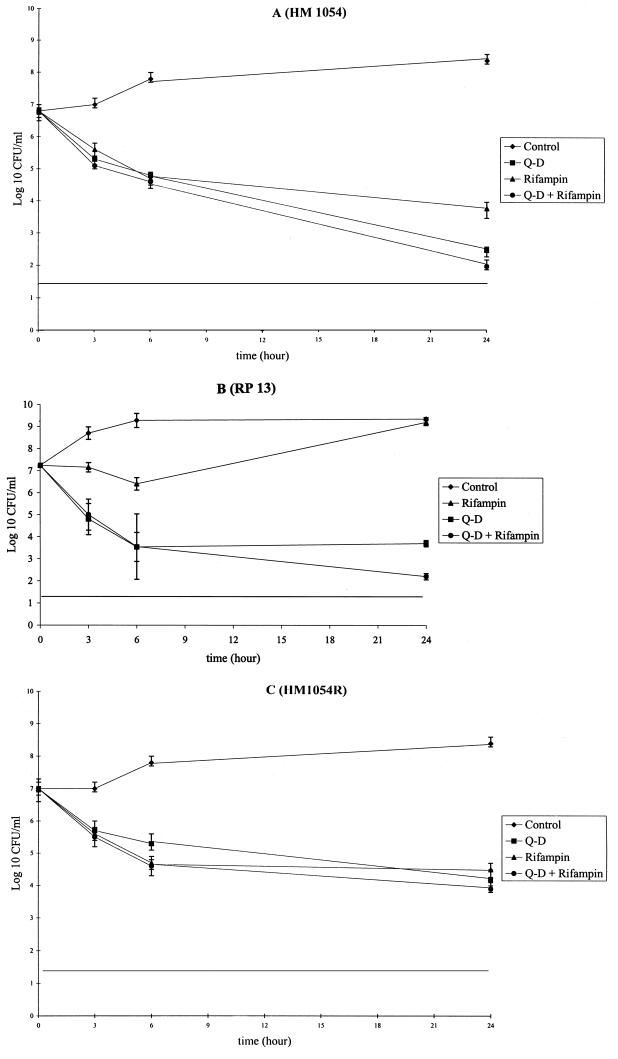
FIG. 1.
Time-kill curves of Staphylococcus aureus HM1054 (A), RP13 (B), and HM1054R (C) grown in Mueller-Hinton broth in the absence (controls) or presence of Q-D and/or rifampin at concentrations of four times the MIC. Each point is the mean of at least two determinations. Vertical bars represent standard deviations.

