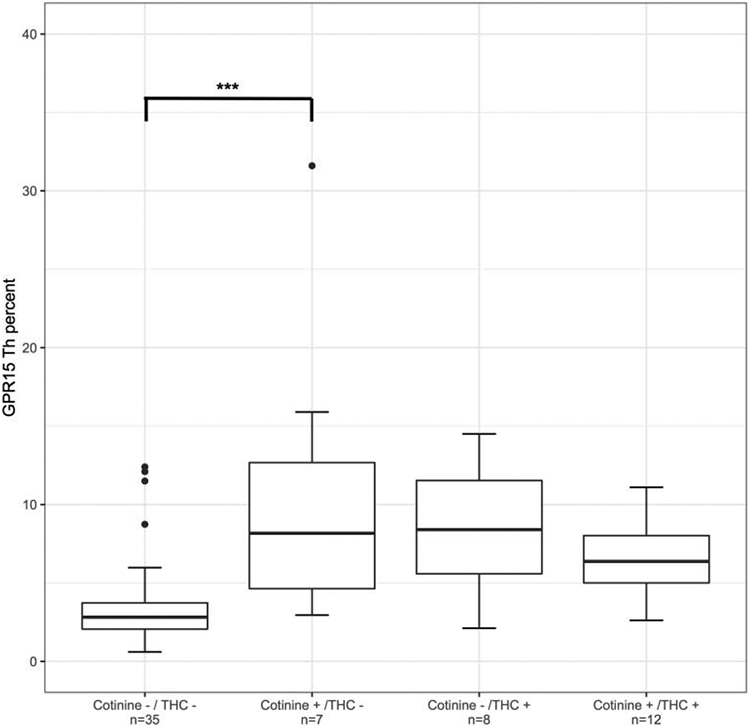
Figure 1.

Boxplots of GPR15+ Th cell percent stratified by self-reported smoking status (tobacco and/or cannabis) and serum positivity (cotinine > 1 ng/mL and/or tetrahydrocannabinol (THC) > 0.5 ng/mL). Error bars indicate +/− 1 SD. Significance codes: * p ≤ 0.05; ** p ≤ 0.01; *** p ≤ 0.001 (Tukey’s Honest Significant Difference).
