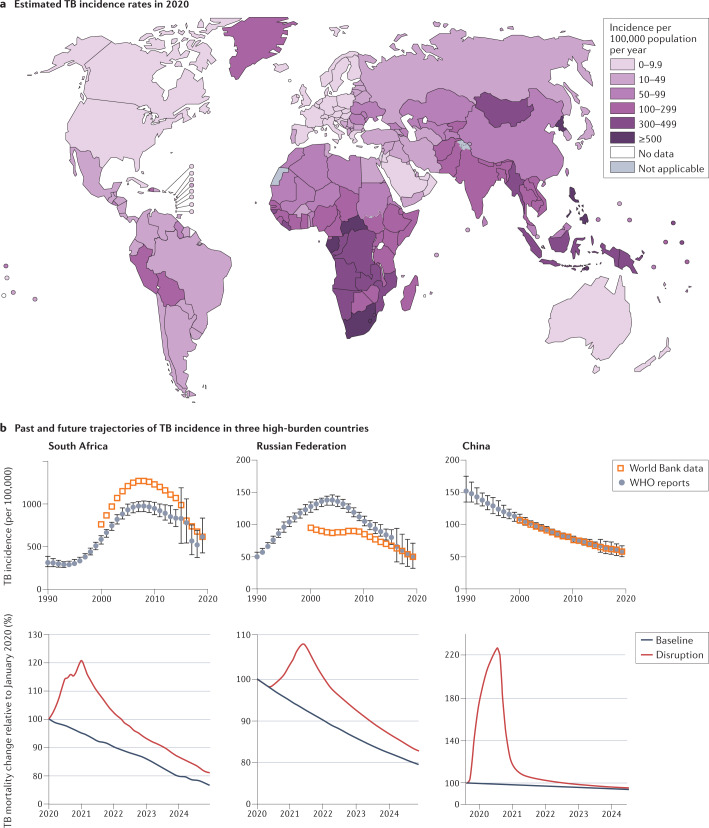
Fig. 1. Global TB burden.
a | Incidence of tuberculosis (TB) per 100,000 population in 2020. Not applicable: WHO criteria for national prevalence survey not met. b | The top graphs represent the incidence of TB in South Africa, the Russian Federation and China from 1990 to 2020. Sub-Saharan Africa has been on an overall trajectory of increased incidence until 2010, mostly driven by the TB–HIV-1 epidemic and the 20-fold increased risk of reactivation in people positive for HIV-1. Initial increase in incidence and mortality in the Russian Federation coincides with the collapse of the Soviet Union and health-care system, which was brought under control after 2000. China has been on a consistent steady decline since 1990. The bottom graphs show the estimated impact of the COVID-19 pandemic on TB mortality in South Africa, the Russian Federation and China up to 2025. Plots were generated using publicly available TB burden data from WHO reports,5,6 and the World Bank database. Part b, top graphs, based on data from WHO global TB reports from 1990 to 2021 and adapted from the World Bank database, CC BY 4.0 (https://creativecommons.org/licenses/by/4.0/). Part a and part b, bottom, adapted with permission from ref.6, WHO.

