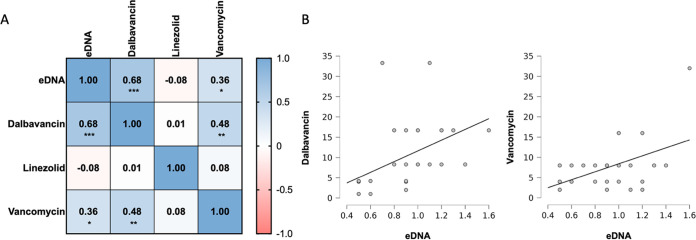
FIG 5.
(A) Correlation matrix based on Spearman’s rank correlation coefficient between the level of eDNA and the biofilm tolerance (BT) for dalbavancin, linezolid, and vancomycin. The BT is the ratio between the MBEC90 (minimum biofilm eradication concentration) and MIC90 values calculated for each antimicrobial agent and strain. (B) Scatter graphs with detailed illustration of the relation between eDNA level and BT for dalbavancin and vancomycin.

