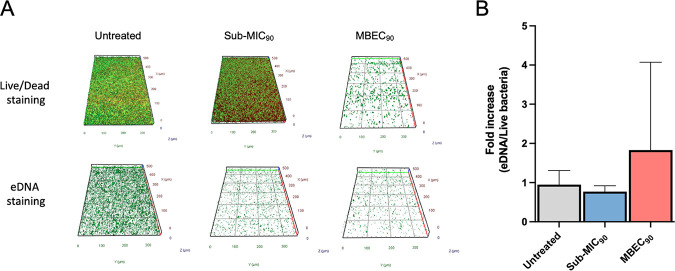
FIG 7.
(A) Representative images of biofilm cells stained with the Live/Dead BacLight bacterial viability kit (BacLight kit) and TOTO-1 for eDNA (green) exposed to dalbavancin (sub-MIC90 and MBEC90) compared to untreated biofilms. (B) Relative abundances of fluorescence intensity of eDNA stained by TOTO-1 and live bacteria stained with the Live/Dead BacLight bacterial viability kit, analyzed with AxioVision 4.8 software, and expressed as the fold increase compared to untreated control cells.

