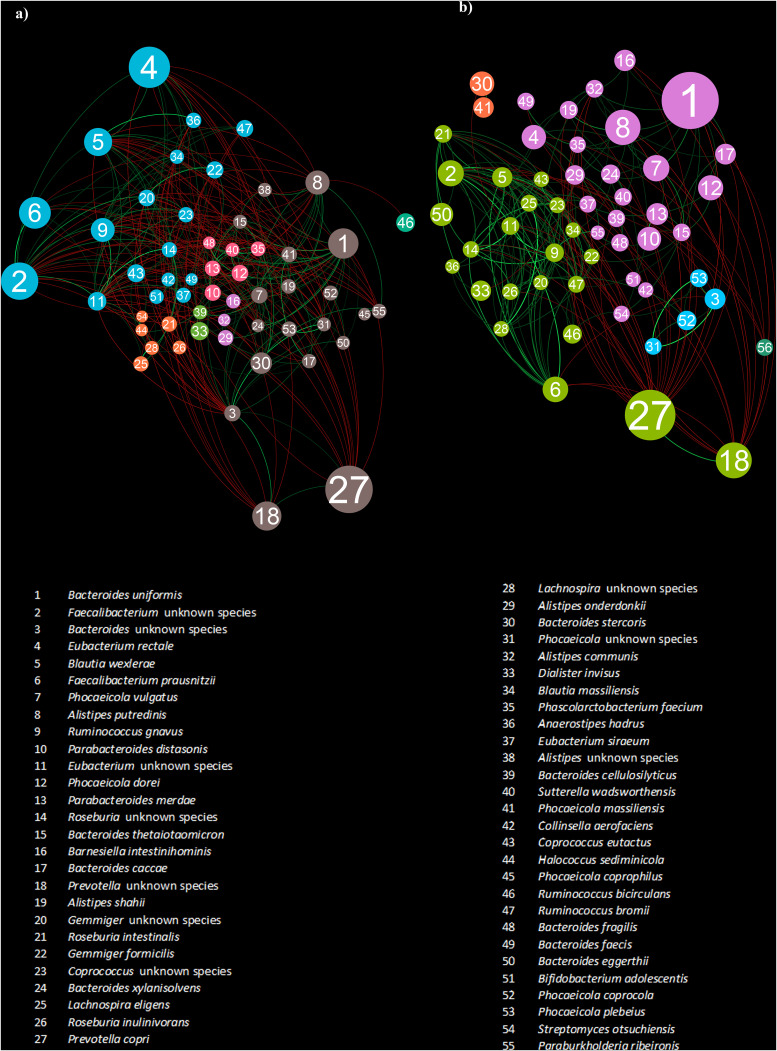
FIG 2.
Interaction network supporting the structure of the gut microbial consortia in athletes and non-athletes. Panel a reports the interaction network of athlete gut microbiota, and panel b depicts the interaction network of the fecal microbial community of non-athletic individuals. In the force-driven networks, nodes represent bacterial taxa, and covariance values were used to construct the edges. Red edges correspond to negative correlations, while green edges represent positive associations. The node size is proportional to the relative average abundance of each taxon.

