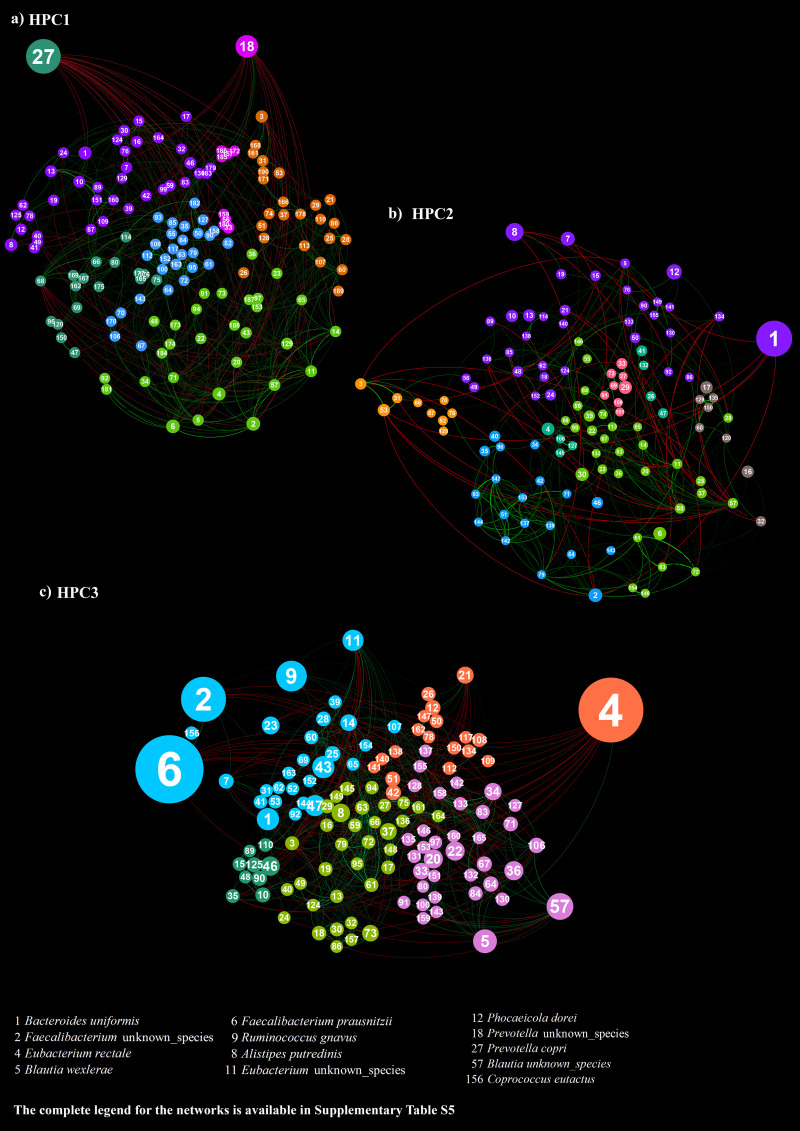
FIG 3.
Co-occurrence network characterizing the three HPCs. The networks visualize the covariance relationships between the microbial taxa composing HPC1 (panel a), HPC2 (panel b), and HPC3 (panel c). HPC1 encompasses 52% of athletes and 48% of non-athletic subjects, HPC2 contains 82% of non-athletes, and HPC3 contains 87% of athletes. The complete one-to-one correspondence between node labels and microbial taxa is available in Table S5.

