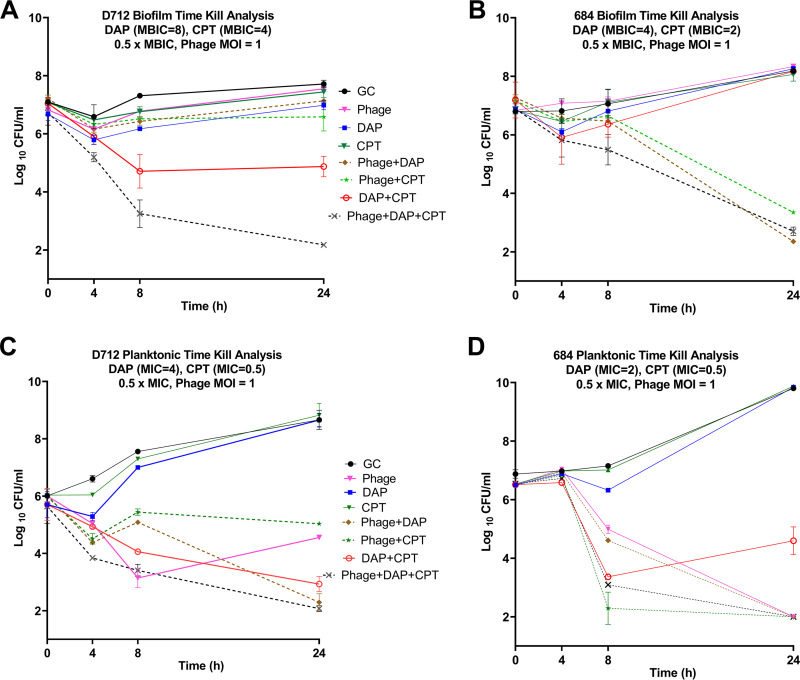
FIG 2.
TKA in biofilm state and planktonic state for D712 and 684. Solid lines represent single-agent treatments, dashed lines represent PAC treatments. Phage: Sb-1 phage, DAP: daptomycin, CPT: ceftaroline, GC: growth control. Detection limit = 2 log10 CFU/mL. Standard deviation < 0.6 for all graphs.

