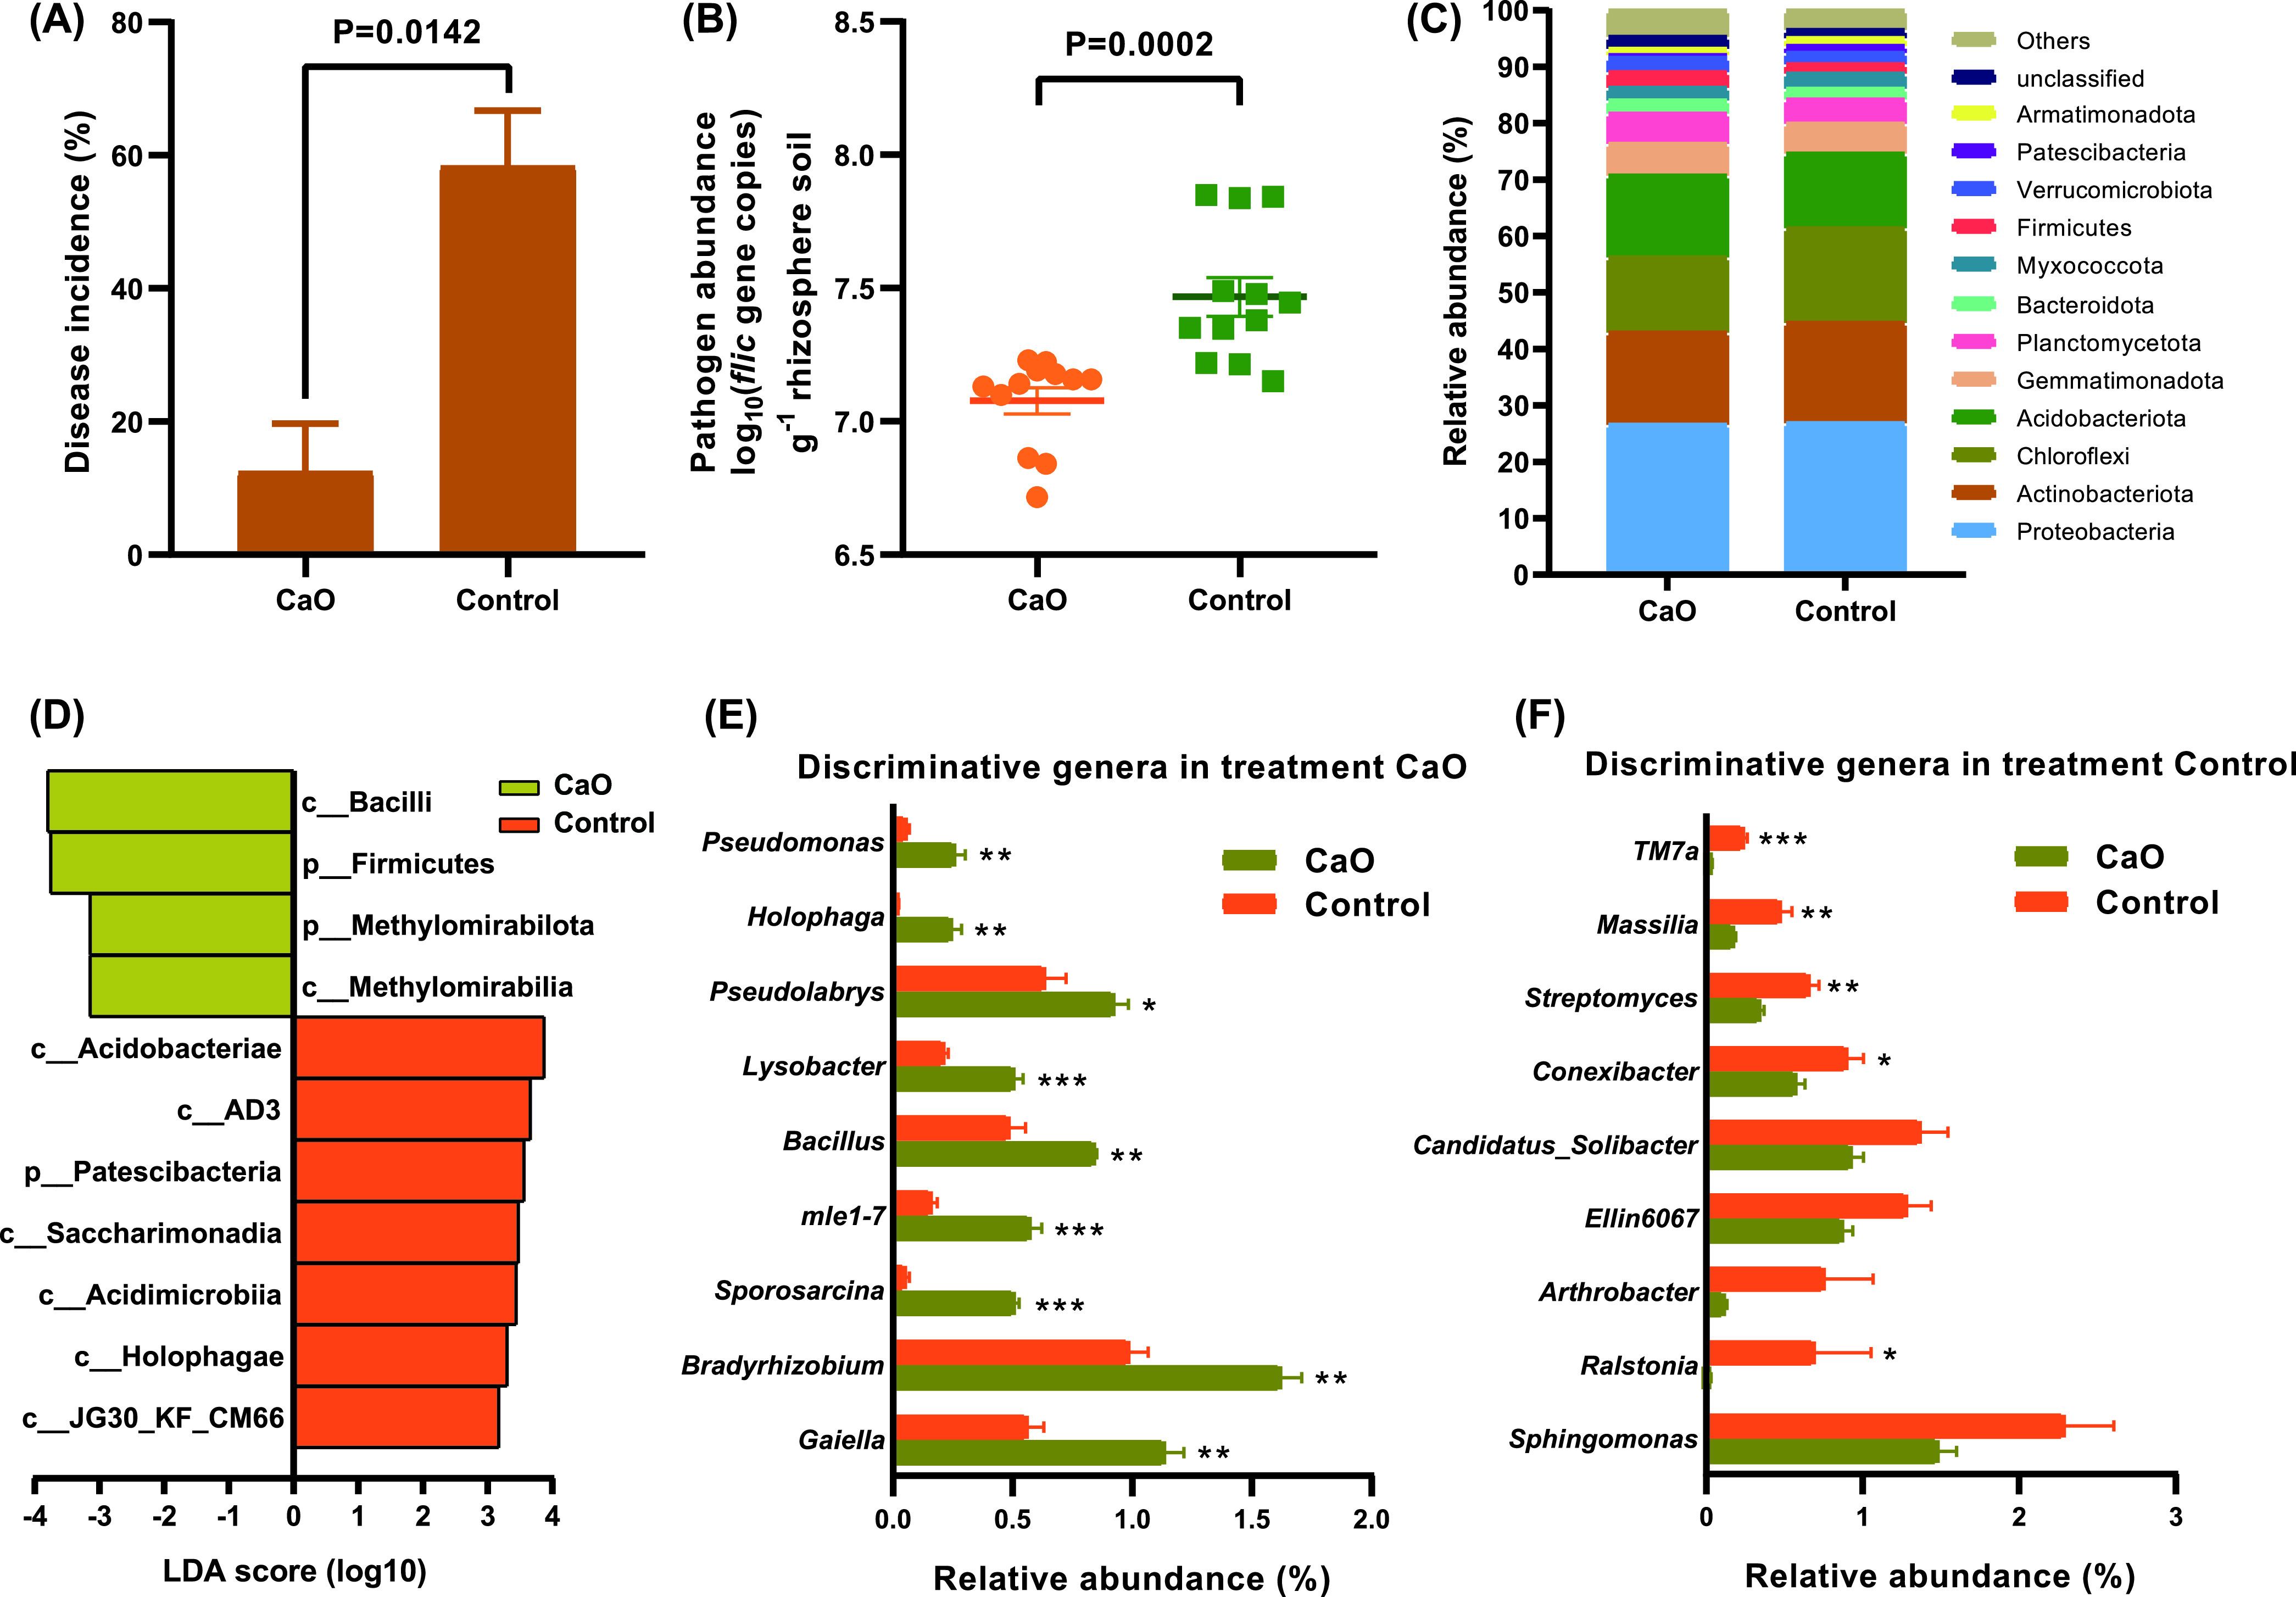
FIG 6.

The occurrence of bacterial wilt and comparison of soil community structure between CaO and control in diseased soil. (A) The effect of CaO treatment on the incidence of bacterial wilt. (B) The influence of CaO treatment on the abundance of pathogen R. solanacearum. (C) The relative abundance of bacterial taxa at phylum level. (D) Histogram of the LDA scores computed for differentially abundant bacterial phyla and classes in CaO and control samples. (E–F) The relative abundances of discriminative genera (LDA > 3.0) in CaO and control samples, respectively. The P value and asterisks indicate significantly (* 0.01 < P ≤ 0.05, ** 0.001 < P ≤ 0.01, ***, P ≤ 0.001) difference between CaO and control, as determined by independent-sample t-test.
