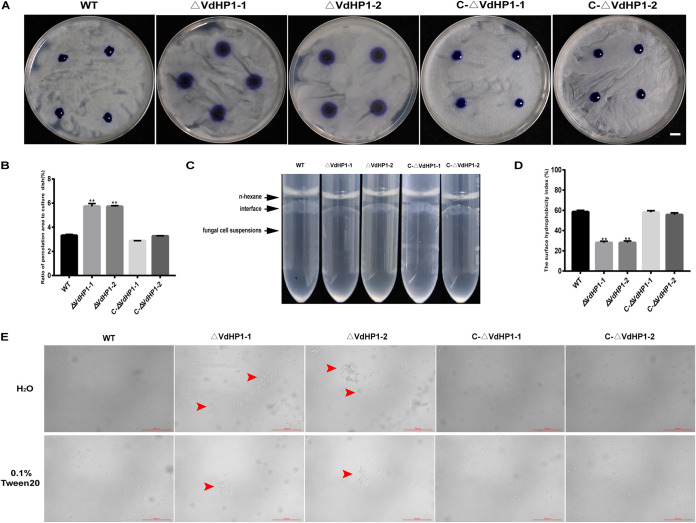
FIG 3.
Comparison of hydrophobicity between WT and mutants. (A) The penetration of various strains to aqueous aniline blue. Bar = 1 cm. (B) Percentage of infiltration area to total petri dish area. Quantitative calculation was performed by Image-Pro Plus (Media Cybernetics, Rockville, MD, USA) software. (C) Surface-displaying hydrophobicity of WT and mutants by the state of the interface between organic phase and water phase. (D) The surface hydrophobicity index of WT, ΔVdHP1, and C-ΔVdHP1 strains conidia. (E) Images of conidial suspensions of WT and mutants suspended in H2O and 0.1% Tween 20 under optical microscope. Red arrows show conidia clustering.

