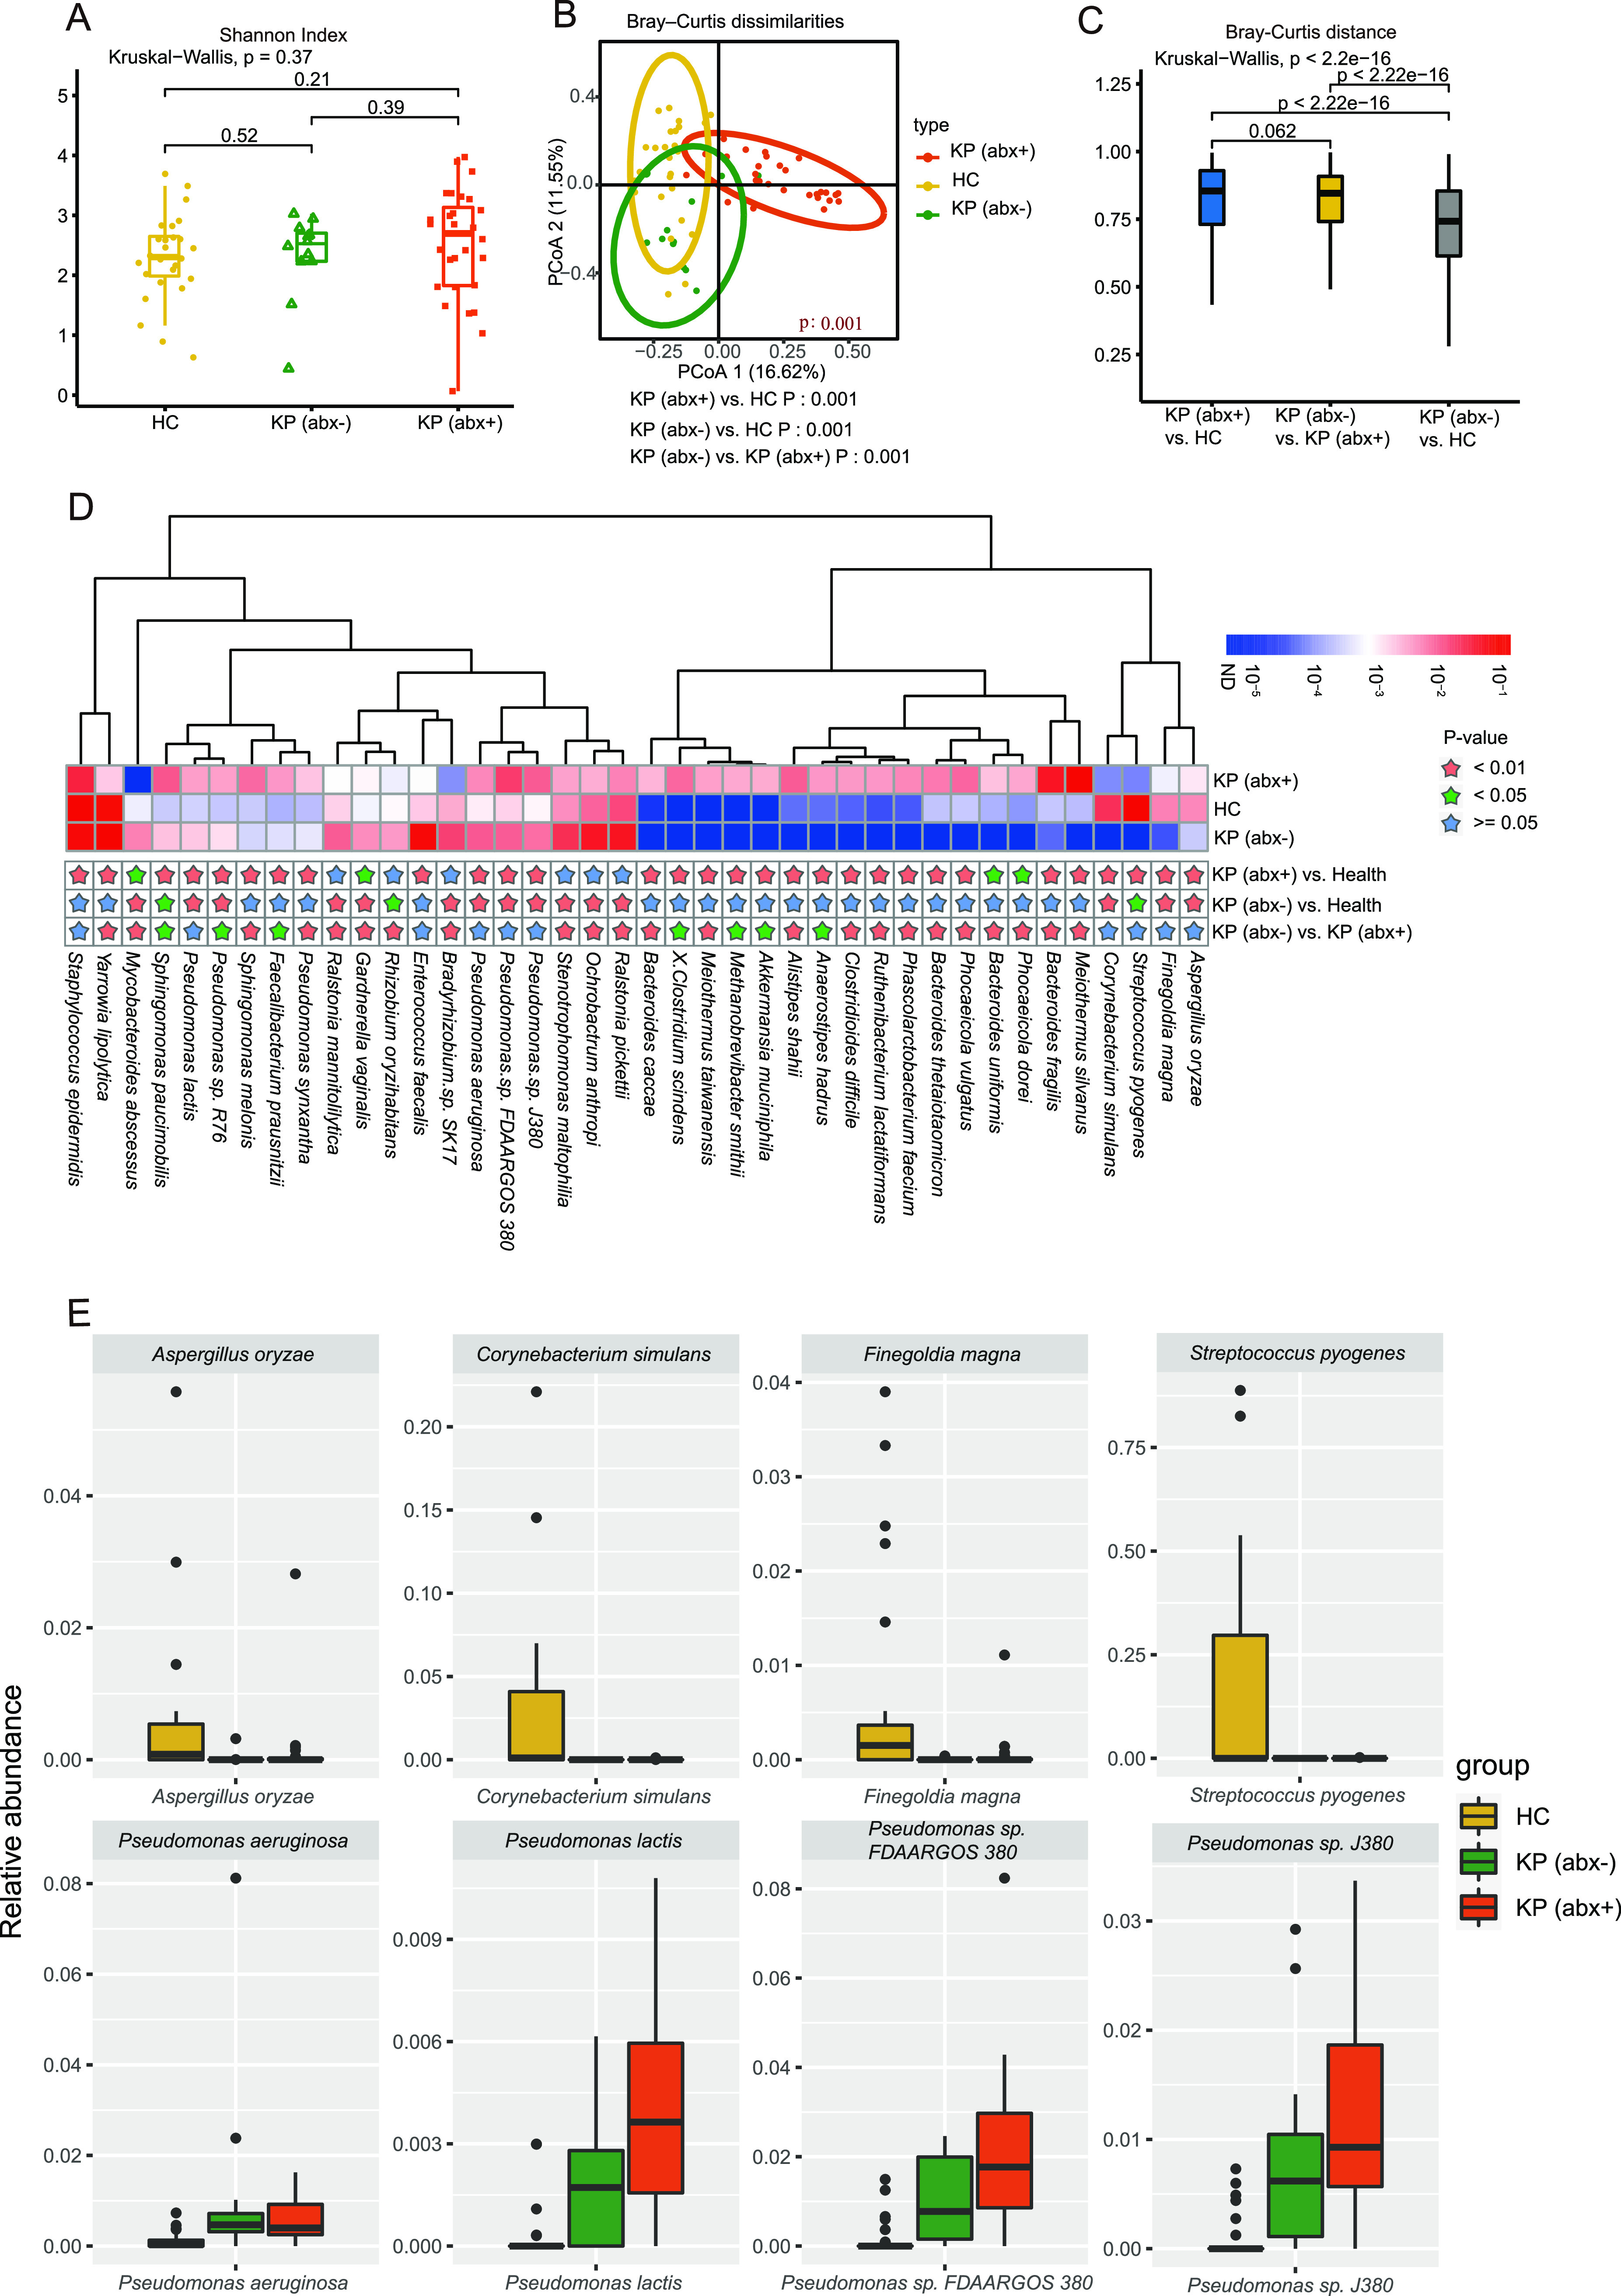
FIG 1.

Microbial communities on the ocular surfaces of the HC group, KP (abx+) group, and KP (abx−) group. (A) Shannon-Wiener indexes for the three groups, i.e., HC group, KP (abx+) group, and KP (abx−) group, were compared at the species level. (B) PCoA plot of Bray-Curtis distances for subjects among the three groups. The P values from the Kruskal-Wallis test comparing the three groups and the Wilcoxon test comparing two groups are shown. (C) Between-group Bray-Curtis distance comparisons among the HC group, KP (abx+) group, and KP (abx−) group. (D) Relative abundance of the top 40 most different species across the groups. Species with P values of <0.01 are labeled with a pink star, those with P values of <0.05 with a green star, and those with P values of ≥0.05 with a blue star. P values are from the Wilcoxon test. (E) Box plots show the distribution of the relative abundance of eight different species among the three groups.
