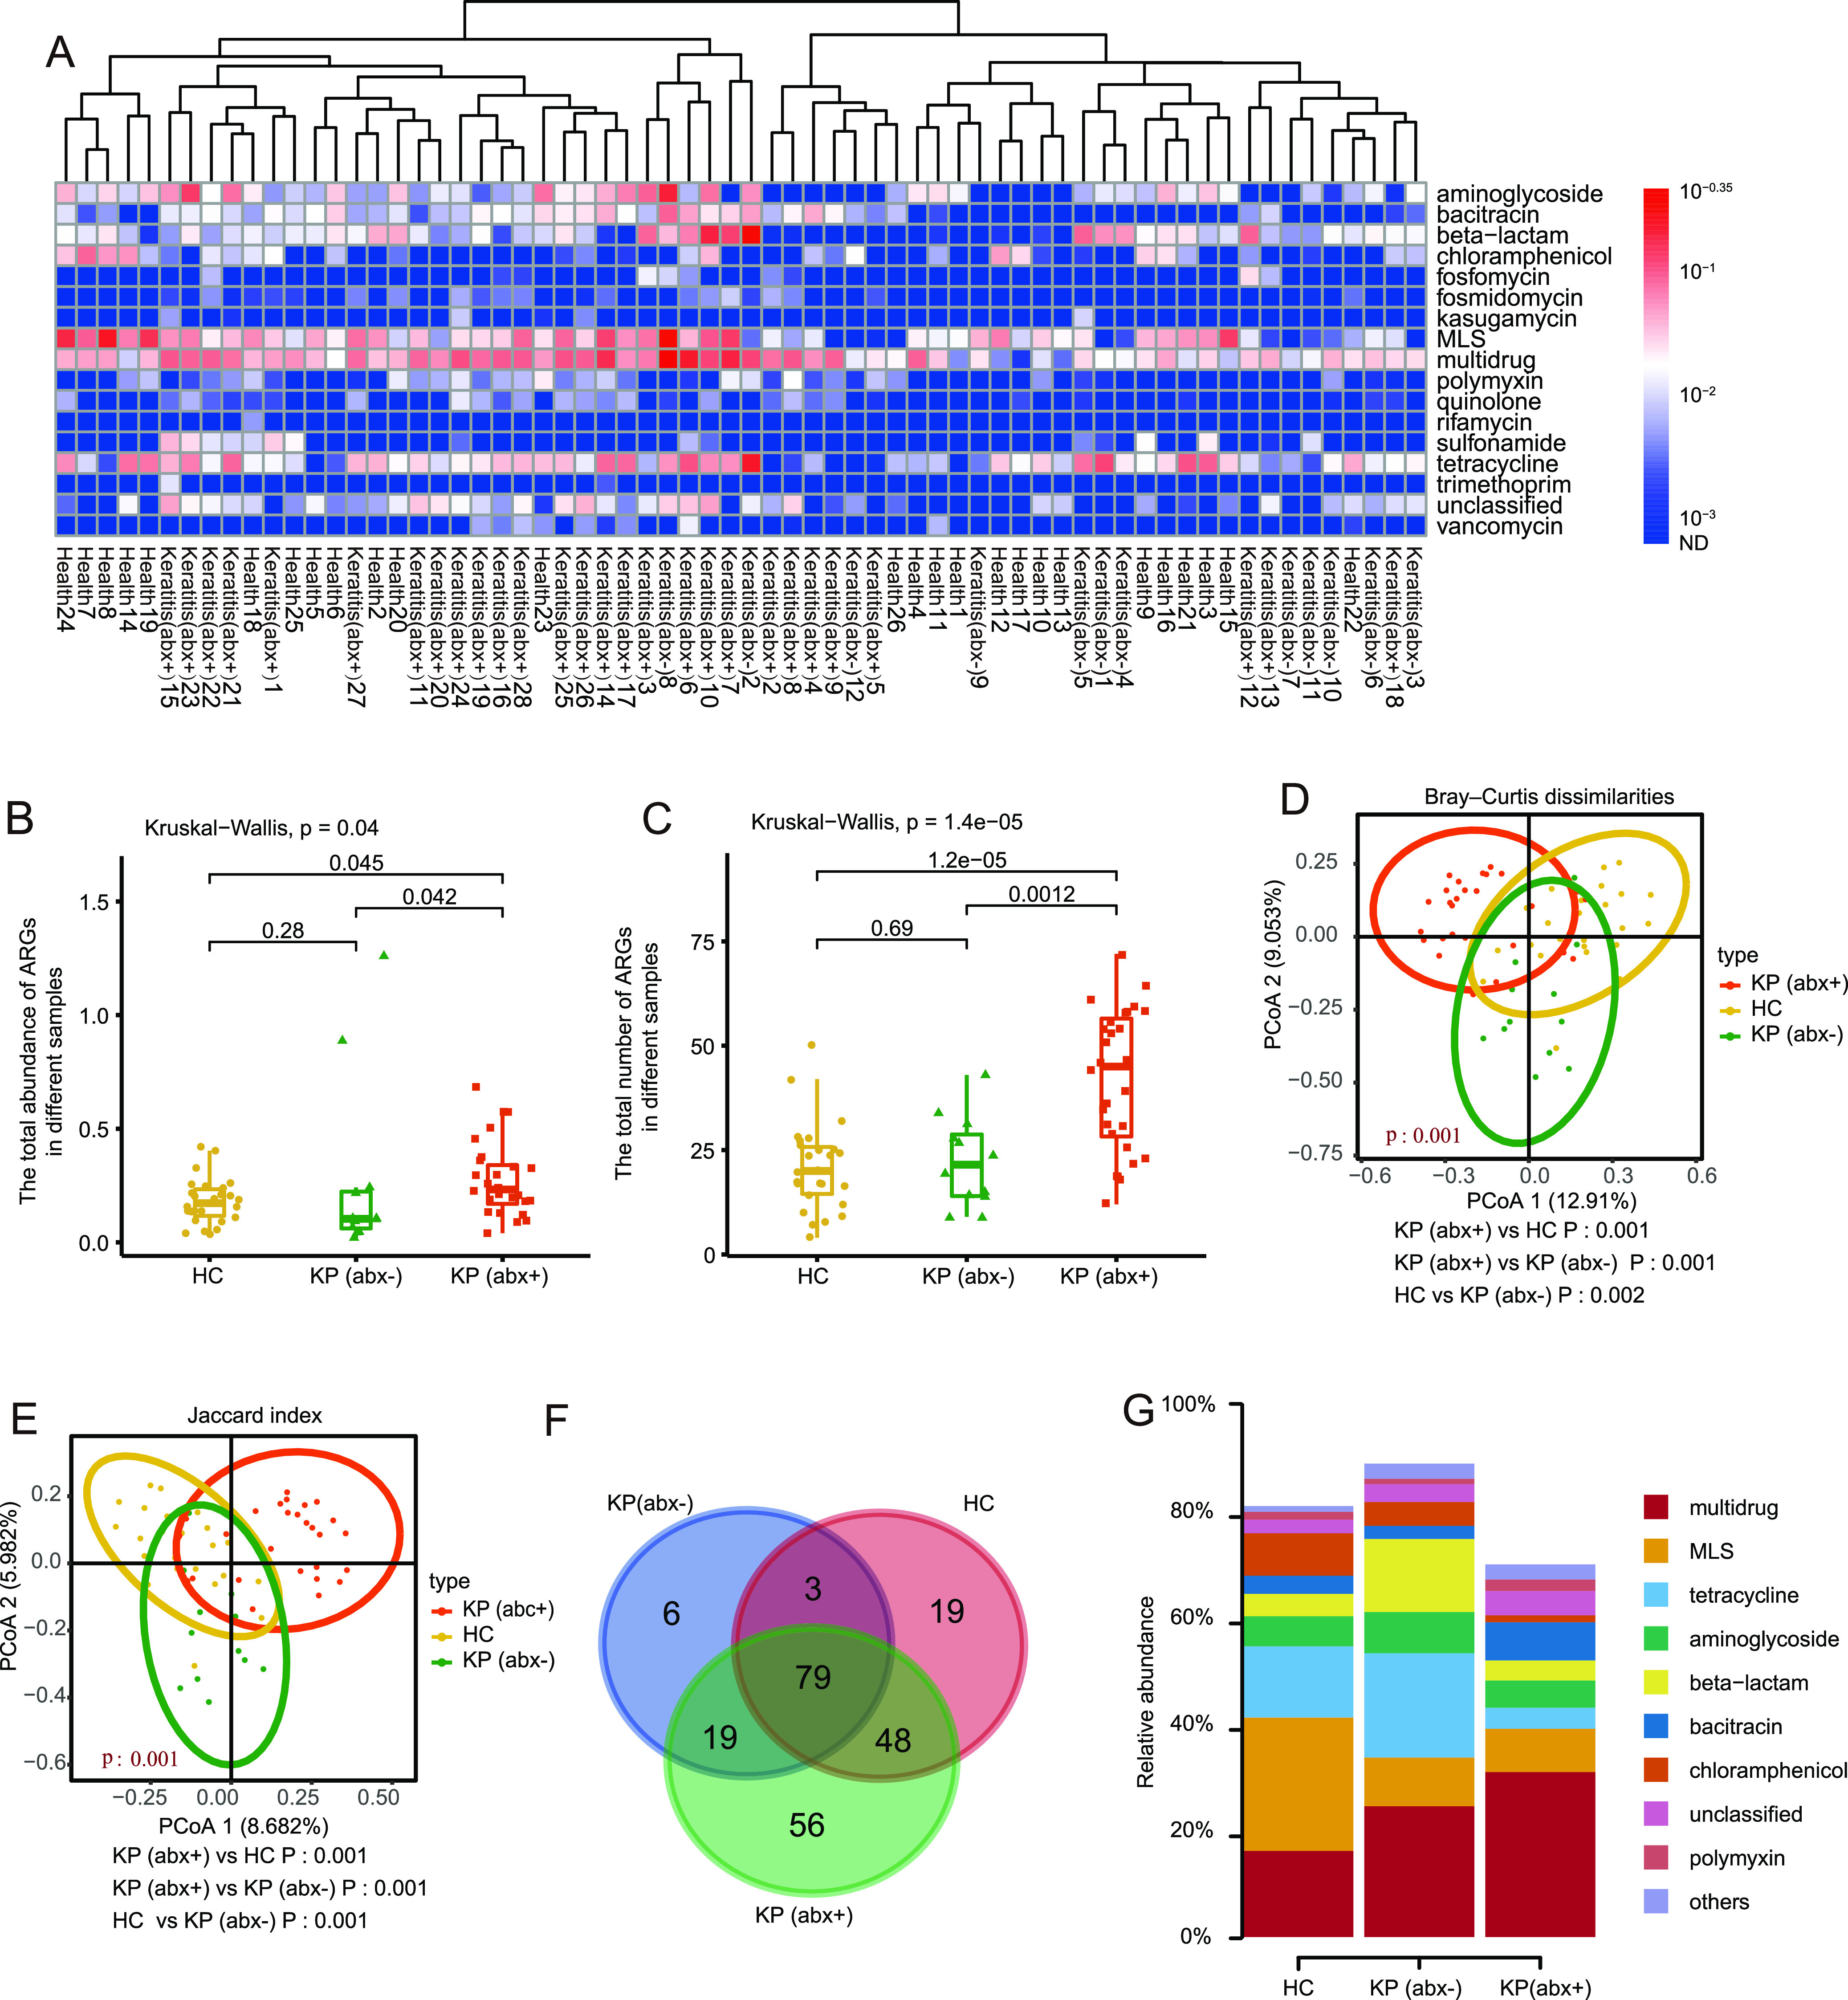
FIG 2.

Antibiotic resistome differences among the HC group, KP (abx+) group, and KP (abx−) group. (A) Broad-spectrum quantitative profiles of the ARG types (copy per 16S rRNA) in 66 subjects. (B and C) Box plots of the abundance (B) and number (C) of ARG subtypes in the HC group, KP (abx+) group, and KP (abx−) group. (D) PCoA of Bray-Curtis distances between groups. (E) PCoA of Jaccard distances between groups. (F) Venn diagram showing the numbers of shared and unique ARG subtypes among the HC group, KP (abx+) group, and KP (abx−) group. (G) Relative abundance of shared ARGs. The P values from the Kruskal-Wallis test comparing the three groups and the Wilcoxon test comparing two groups are shown.
